

Gerir a infraestrutura de TI pode ser uma dor de cabeça, especialmente quando as ferramentas que utiliza atualmente não se adequam às suas necessidades. Pode estar a utilizar o Zabbix, mas considerá-lo insuficiente em algumas áreas. Talvez seja a complexidade ou a falta de integrações específicas que o esteja a levar a procurar alternativas.
Na minha experiência, encontrar a solução de monitorização de código aberto certa pode fazer uma grande diferença para a sua equipa. Deve facilitar o seu trabalho, não complicá-lo. Analisei várias opções para lhe dar uma visão imparcial das melhores alternativas ao Zabbix.
Neste artigo, encontrará uma análise detalhada de cada ferramenta, destacando aquilo que as diferencia. Quer procure uma melhor escalabilidade ou funcionalidades específicas, encontrará aqui o que precisa.
O que é o Zabbix?
O Zabbix é uma solução de monitorização de código aberto que acompanha o desempenho e a disponibilidade da infraestrutura de TI. É normalmente utilizado por administradores de TI, engenheiros de redes e equipas de DevOps para monitorizar recursos de rede, servidores e aplicações. Os alertas automatizados, a visualização de dados e as funcionalidades de escalabilidade ajudam a identificar problemas, otimizar a utilização de recursos e assegurar a fiabilidade dos sistemas. Em geral, o Zabbix oferece uma base sólida para manter e observar ambientes de TI.
Tabela de comparação das alternativas ao Zabbix
Esta tabela de comparação resume os detalhes de preços das minhas principais alternativas ao Zabbix:
| Tool | Best For | Trial Info | Price | ||
|---|---|---|---|---|---|
| 1 | Best for unified monitoring | Free plan + 30-day free trial available | From $200/month (billed annually) | Website | |
| 2 | Best centralized monitoring for large enterprises | Free plan + 60-day trial + demo available | From $1,400/year (billed annually) | Website | |
| 3 | Best for zero configuration real-time metrics | 14-day free trial + free plan + free demo available | From $4.50/node/month (billed annually) | Website | |
| 4 | Best for pre-built monitoring for cloud services | Free plan available | From $15/month (billed annually) | Website | |
| 5 | Best for plugin-driven custom monitoring logic | Free demo + free plan available | From $2,595/100 nodes | Website | |
| 6 | Best for usage-based observability pricing | Free plan available | From $10/user/month | Website | |
| 7 | Best for cost-effective, all-in-one monitoring | Free plan available | From $29/user/month (billed annually) | Website | |
| 8 | Best for managed ELK with guided setup | Free 14-day trial + free demo available | From $9/month (billed annually) | Website | |
| 9 | Best for automatic SNMP network discovery | Free demo available | Free to use | Website | |
| 10 | Best for open-source observability | 30-day free trial + free demo available | From $49/month | Website |


Why Trust Our Software Recommendations
6,700+
Reviews
20
Industry experts
16+
Evaluation factors
14
Years
Our team has been testing and reviewing software since 2012. As tech leaders ourselves, we know how difficult—and important—it is to choose the right software.
For this guide, we evaluated tools using hands-on testing and independent research, scoring tools using our selection criteria.
Our reviews reflect our human editorial judgment, not a sales pitch.
Expert reviewers:
- Paulo Gardini MiguelTech Director
 Tim FisherVP of AI
 Gabriel RosasTech Lead & Software Architect
 Christhian GruhnTech Lead & Platform Architect

Análises das melhores alternativas ao Zabbix
Seguem-se os meus resumos detalhados das melhores alternativas ao Zabbix que entraram na minha lista. As minhas análises apresentam uma visão detalhada das principais funcionalidades, vantagens e desvantagens, integrações e casos de utilização ideais de cada ferramenta, para o ajudar a encontrar a melhor opção para si.
 Best for unified monitoring
- Free plan + 30-day free trial available
- From $200/month (billed annually)
Visit WebsiteCustomer Rating:4.6/5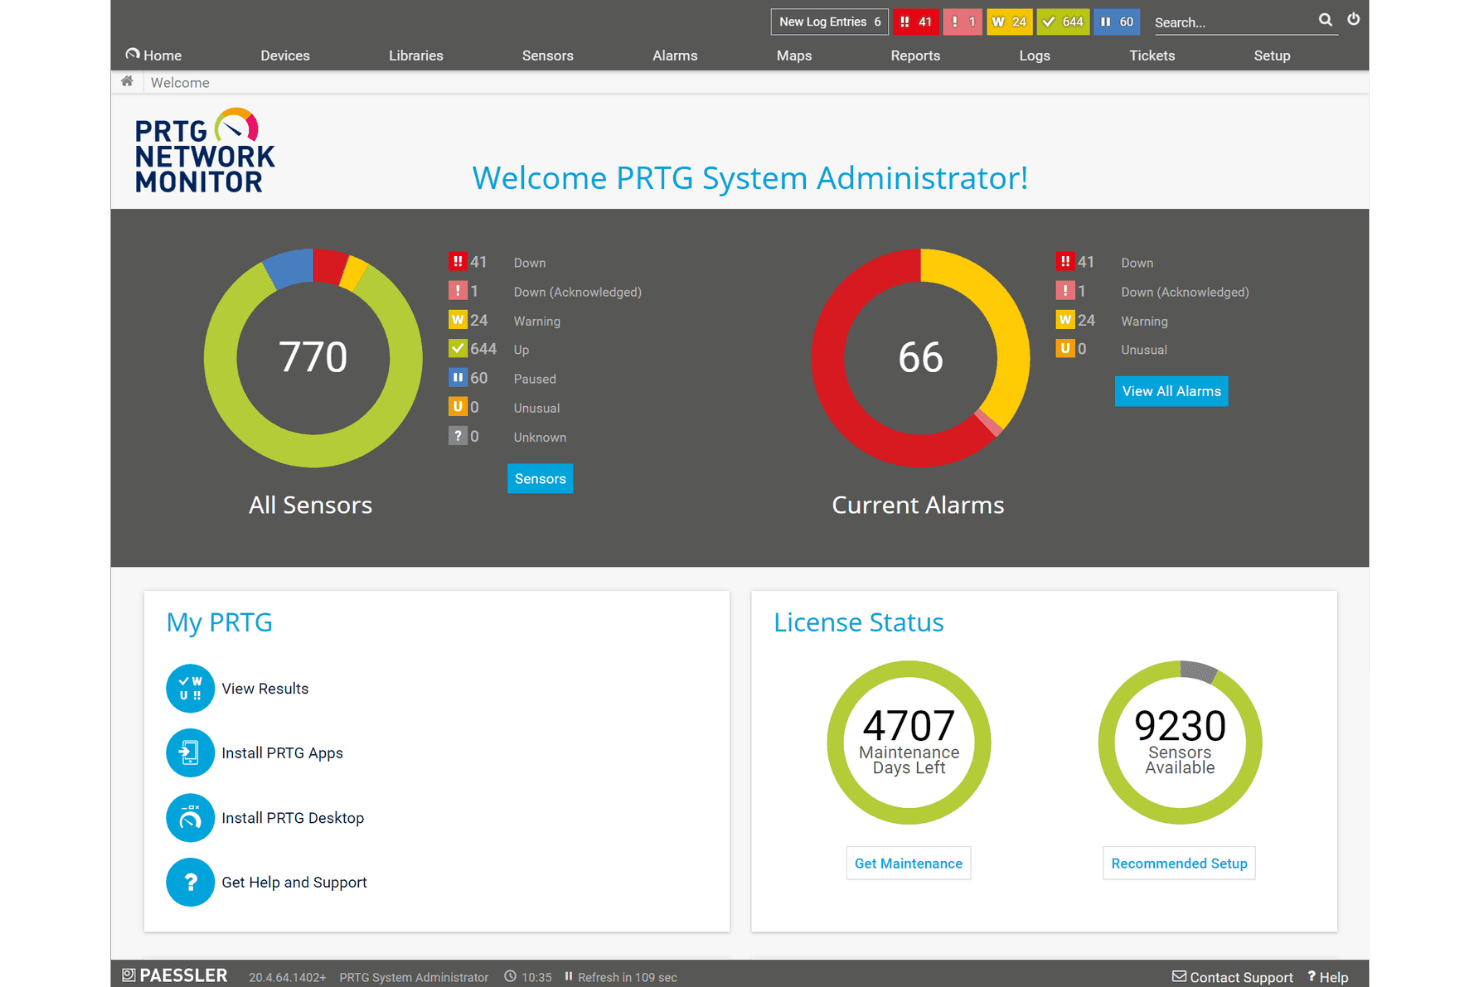
Paessler PRTG displays a centralized network monitoring dashboard with sensor status, current alarms, and license information at a glance. Paessler PRTG is an all-in-one infrastructure monitoring platform that helps IT teams track networks, servers, applications, and cloud services from a single interface — without the manual configuration overhead of open-source tools like Zabbix.
Who Is Paessler PRTG Best For?
It's a strong fit for mid-sized IT teams and NOC operators who need fast, reliable visibility across mixed on-premises and cloud environments without building monitoring from scratch.
Why Paessler PRTG Is a Good Zabbix Alternative
I've included Paessler PRTG in my top picks because it delivers genuine hybrid visibility in a way Zabbix requires significant custom work to replicate. PRTG's sensor-based architecture covers SNMP, WMI, NetFlow, MQTT, and Modbus TCP through one interface, with no separate plugins or manual exporters to configure. I especially like the Multi-Platform Probe, which pulls OT and industrial device data into the same dashboards as your cloud and network monitoring, making it one of the few tools where IT and OT converge without a separate integration layer.
Paessler PRTG Key Features
- Sensor-based licensing: Each metric you monitor counts as a sensor, letting you customize coverage with predictable costs.
- Custom map designer: Build real-time infrastructure maps using drag-and-drop to visualize topology and health at a glance.
- Multi-channel notifications: Set up alerts through email, push notifications, HTTP requests, or Microsoft Teams for flexible response workflows.
- Remote probes: Deploy probes across remote sites or networks to enable distributed, centralized monitoring from a single dashboard.
Paessler PRTG Integrations
Paessler PRTG offers native integrations with Microsoft Teams, AWS, Azure, Google Cloud Platform, Siemens Industrial Edge, and ServiceNow. An API is available for custom integrations.
Pros and Cons
Pros:
- Monitors OT and IT in one platform
- Scales across distributed sites via remote probes
- Auto-discovery speeds up initial environment setup
Cons:
- Web interface feels dated versus newer alternatives
- Sensor count grows expensive at larger scales
Learn more about Paessler PRTG: Best centralized monitoring for large enterprises
- Free plan + 60-day trial + demo available
- From $1,400/year (billed annually)
Visit WebsiteCustomer Rating:4.7/5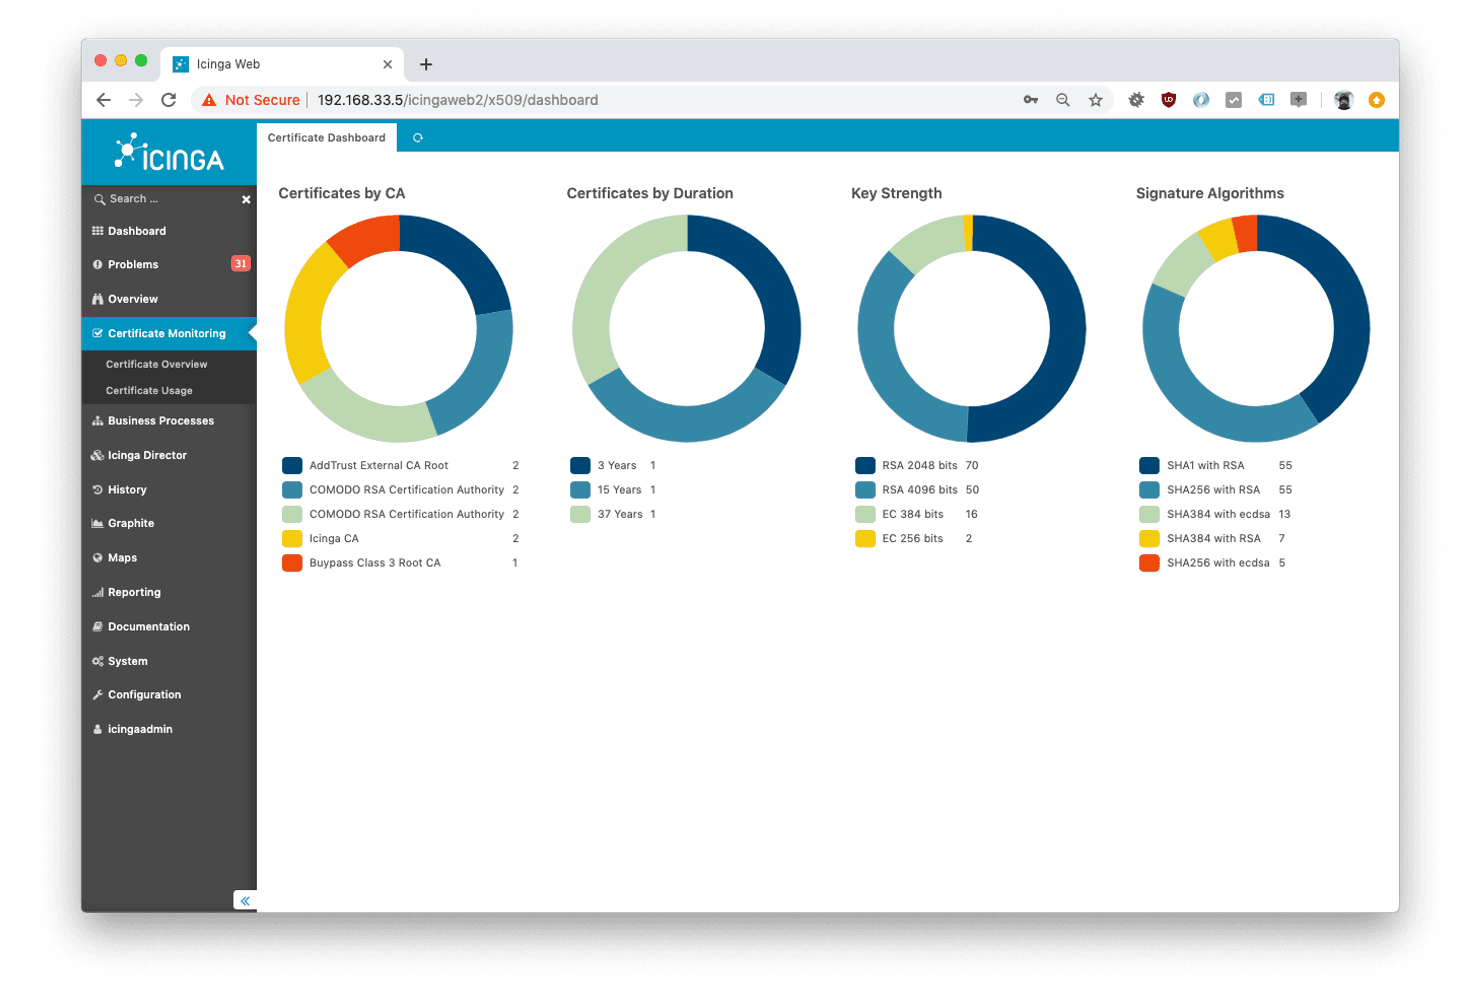
Icinga monitors infrastructure health and flags performance issues. Icinga is a monitoring solution tailored for IT professionals managing complex infrastructures. Automated alerts, data visualization, and scalability features help identify issues, optimize resource use, and uphold system reliability.
Why it's a good Zabbix alternative: Its modular architecture allows for extensive customization and self-hosted monitoring, making it well-suited for intricate IT environments. Unlike Zabbix, Icinga offers flexible configuration options that adapt to your specific infrastructure needs. The ability to create an efficient monitoring system for large environments sets this solution apart. With its focus on scalability, you can grow your monitoring as your infrastructure expands.
Standout Features and Integrations:
Features include distributed monitoring, customizable dashboards, and advanced alerting mechanisms. Distributed monitoring allows you to oversee multiple locations from a single platform. Customizable dashboards give you control over how you view your data.
Integrations include Grafana, Prometheus, Elastic, AWS, Azure, Docker, Kubernetes, Puppet, Ansible, Chef, and more.
Pros and Cons
Pros:
- Strong support for complex, distributed environments
- Flexible configuration with fine-grained control
- Highly scalable solution
Cons:
- Complex manual setup
- Limited built-in templates
Learn more about Icinga: Best for zero configuration real-time metrics
- 14-day free trial + free plan + free demo available
- From $4.50/node/month (billed annually)
Visit WebsiteCustomer Rating:4.8/5
Netdata monitors system performance with real-time health insights. Netdata is a monitoring solution designed for IT professionals and DevOps teams who need real-time data to manage their infrastructure. It provides insights into system performance and health metrics, helping teams identify and resolve issues quickly.
Why it's a good Zabbix alternative: With real-time monitoring, interactive dashboards, and dynamic data visualization, Netdata delivers immediate insights to support quick decision-making. Unlike Zabbix, Netdata has more intuitive visual representations of data, making it easier for teams to understand system performance. The platform’s focus on real-time analytics helps you spot problems as they occur. Its user-friendly and intuitive interface delivers a smoother experience for tracking and diagnosing issues.
Standout Features and Integrations:
Features include automatic anomaly detection, customizable alarms, and detailed system health metrics. You can access a wide range of infrastructure monitoring capabilities tailored to different needs. The platform is designed to provide continuous insights without overwhelming you with unnecessary data.
Integrations include AWS, Azure, Google Cloud, Kubernetes, Docker, Slack, PagerDuty, Opsgenie, Prometheus, Grafana, and more.
Pros and Cons
Pros:
- Lightweight agent with low overheads
- Zero configuration auto-discovery
- Real-time, per-second system metrics
Cons:
- Advanced features require technical knowledge
- Limited historical data storage
Learn more about Netdata: Best for pre-built monitoring for cloud services
- Free plan available
- From $15/month (billed annually)
Visit WebsiteCustomer Rating:4.5/5
Datadog analyzes metrics, logs, and traces across cloud systems. Datadog is a monitoring and analytics platform used by IT and DevOps teams to oversee cloud applications and infrastructure. It helps businesses track performance metrics, logs, and traces to support system reliability.
Why it's a good Zabbix alternative: Datadog's cloud integration capabilities make it ideal for teams using various cloud services. Its unified platform allows you to monitor applications, logs, and metrics in one place, which is essential for modern IT environments. The focus on cloud-native environments offers flexibility and ease in managing your cloud resources.
Standout Features and Integrations:
Features include real-time interactive dashboards, anomaly detection, and machine learning-based alerts. Real-time dashboards provide a clear view of your system's health. Anomaly detection helps you identify unusual patterns before they become issues.
Integrations include AWS, Azure, Google Cloud, Docker, Kubernetes, Slack, PagerDuty, GitHub, Jira, Terraform, and more.
Pros and Cons
Pros:
- Application monitoring and insights
- Unified monitoring platform
- Extensive integrations across cloud and SaaS tools
Cons:
- Complex pricing and usage tracking
- Costs can increase quickly at scale
 Best for plugin-driven custom monitoring logic
- Free demo + free plan available
- From $2,595/100 nodes
Visit WebsiteCustomer Rating:4.3/5
Nagios tracks system uptime and alerts teams to performance issues. Nagios is a monitoring solution used primarily by IT professionals and system administrators to track network systems, servers, and applications. Automated alerts, data visualization, and scalability features help identify issues, optimize resources, and uphold system reliability.
Why it's a good Zabbix alternative: Nagios offers a wide range of plugins that can be customized to monitor various environments. This flexibility makes it ideal for teams with unique or complex IT setups. You can create and implement plugins to suit different monitoring needs, which improves adaptability.
Standout features and integrations:
Features include real-time alerting, performance data collection, and customizable dashboards. Real-time alerting keeps you informed of potential issues as they happen. The customizable dashboards let you create a monitoring view that suits your preferences.
Integrations include AWS, Azure, VMware, Docker, Slack, PagerDuty, ServiceNow, Splunk, Elasticsearch, Jira, and more.
Pros and Cons
Pros:
- Large ecosystem and community plugins and APIs
- Extensive customization for monitoring logic
- Mature, open-source tool
Cons:
- Manual configuration and maintenance overhead
- Outdated interface
Learn more about Nagios: Best for usage-based observability pricing
- Free plan available
- From $10/user/month
Visit WebsiteCustomer Rating:4.3/5
New Relic surfaces app performance issues quickly. New Relic is an application performance monitoring tool used by developers and IT teams to track and optimize application performance. It helps you gain insights into your applications, infrastructure, and customer experience.
Why it's a good Zabbix alternative: New Relic provides detailed application performance insights with a focus on user experience. Its real-time analytics let you continuously monitor application health and performance. Usage-based pricing offers flexibility for teams looking to manage costs effectively. This pricing model allows your team to scale monitoring efforts based on usage, optomizing cost efficiency.
Standout Features and Integrations:
Features include real-time analytics, distributed tracing, and AIOps capabilities. Real-time analytics provide instant insights into application performance. Distributed tracing helps you track requests across services to identify bottlenecks.
Integrations include AWS, Azure, Google Cloud, Kubernetes, Docker, Slack, PagerDuty, Jira, ServiceNow, GitHub, and more.
Pros and Cons
Pros:
- Focus on user experience
- Strong application performance monitoring
- Usage-based pricing flexibility
Cons:
- Feature-dense user interface
- Monthly costs vary based on data ingestion and query volume
Learn more about New Relic: Best for cost-effective, all-in-one monitoring
- Free plan available
- From $29/user/month (billed annually)

Better Stack monitors uptime and reliability. Better Stack is an observability platform used by IT professionals and DevOps teams to monitor infrastructure and applications. It focuses on incident management, uptime monitoring, and log management to help teams maintain system reliability.
Why it's a good Zabbix alternative: Its cost-effective pricing makes it a great choice for managing expenses while maintaining monitoring quality. Unlike Zabbix, Better Stack has AI-driven error tracking and a serverless ClickHouse data warehouse, allowing you to analyze data without vendor lock-in. The platform’s user-friendly interface simplifies monitoring processes for your team. Features such as incident management and uptime monitoring deliver in-depth oversight at a lower cost.
Standout Features and Integrations:
Features include automated root cause analysis, visual investigation tools, and unlimited alert notifications. Automated root cause analysis helps your team quickly identify and resolve issues. Visual investigation tools provide a clear view of slow requests and errors.
Integrations include Slack, Microsoft Teams, Jira, OpenTelemetry, Prometheus, AWS, Azure, Google Cloud, GitHub, PagerDuty, and more.
Pros and Cons
Pros:
- Simple and modern user interface
- AI-driven error tracking features
- Combines uptime monitoring, logging, and incident response
Cons:
- Limited advanced analytics
- Limited feature set for large enterprises
Learn more about Better Stack: Best for managed ELK with guided setup
- Free 14-day trial + free demo available
- From $9/month (billed annually)
Visit WebsiteCustomer Rating:4.5/5
Logit.io aggregates observability data in one place. Logit.io is a managed observability platform designed for IT professionals and DevOps teams, and focuses on log management and application performance monitoring. It centralizes logs, metrics, and traces, helping teams monitor and analyze data from various sources.
Why it's a good Zabbix alternative: Its focus on ease of use makes Logit.io accessible for teams looking for straightforward monitoring solutions. Its user-friendly interface with customizable dashboards helps you to visualize data. Real-time data analysis and advanced alerting enable you to stay on top of issues without the complexity. The platform's managed services mean you spend less time on setup and maintenance.
Standout Features and Integrations:
Features include real-time data analysis, advanced alerting, and customizable dashboards. Real-time data analysis delivers the latest information at your fingertips. Advanced alerting keeps you informed of potential issues as they arise.
Integrations include OpenSearch, Grafana, Prometheus, AWS, Azure, Google Cloud, Elasticsearch, Logstash, Kibana, OpenTelemetry, and more.
Pros and Cons
Pros:
- Guided setup and simplified onboarding
- User-friendly interface
- Managed ELK and OpenSearch environments
Cons:
- Not as customizable as self-managed stacks
- Managed updates may occasionally lag
Learn more about Logit.io:

LibreNMS maps network performance metrics. LibreNMS is a network monitoring tool used by administrators and IT professionals to monitor and manage network devices. It provides insights into network performance and helps maintain efficient operations.
Why it's a good Zabbix alternative: LibreNMS supports a variety of network protocols for enabling device detection and monitoring. Its automatic network discovery features make it easier for your team to manage a wide range of devices. The tool offers customizable alerting, so you stay informed about network issues in real-time. Its focus on network discovery enables you to manage devices in dynamic environments efficiently.
Standout Features and Integrations:
Features include detailed performance graphs, customizable alerting, and a mobile-friendly interface. Detailed performance graphs help you visualize network data effectively. Customizable alerting helps you receive notifications that matter to you.
Integrations include Slack, PagerDuty, Opsgenie, Microsoft Teams, VictorOps, Webex Teams, Mattermost, Discord, and more.
Pros and Cons
Pros:
- Community-driven updates and plugins
- Strong support for a wide range of network hardware
- Automatic network device discovery via SNMP
Cons:
- Limited application and server monitoring capabilities
- Requires SNMP knowledge for initial setup
Learn more about LibreNMS:

SigNoz detects bottlenecks in application performance. SigNoz is an observability platform that helps developers and DevOps teams to monitor and troubleshoot applications. It provides detailed insights into application performance and helps with identifying and resolving issues.
Why it's a good Zabbix alternative: SigNoz focuses on providing deep application-level insights, making it suitable for teams focusing on application performance. Its open-source observability tools make it easier for teams to customize and extend their monitoring capabilities. SigNoz offers features such as distributed tracing and log management to improve visibility. With its open-source nature, you can tailor the platform to fit your specific needs.
Standout Features and Integrations:
Features include distributed tracing, customizable dashboards, and real-time log management. Distributed tracing helps you track requests across services and identify bottlenecks. Customizable dashboards let you visualize key metrics in a way that suits your team's workflow.
Integrations include Prometheus, Grafana, OpenTelemetry, Kubernetes, Docker, AWS, Azure, Google Cloud, Elastic, Slack, and more.
Pros and Cons
Pros:
- OpenTelemertry tracing and metrics
- Deep application insights Native
- Open-source observability with full data ownership
Cons:
- Smaller ecosystem than commercial platforms
- Requires technical and operational expertise to manage
Learn more about SigNoz:
Outras alternativas ao Zabbix
Eis algumas alternativas adicionais ao Zabbix que não entraram na minha lista, mas que vale a pena conhecer:
- 11CheckmkBest for high-performance monitoring at scale
- 12PulsewayBest for mobile-first IT monitoring
- 13DynatraceBest for AI-based root cause analysis
- 14ManageEngine OpManagerBest for network visualization and topology
- 15LogicMonitorBest for cloud-native infrastructure monitoring
- 16OpenNMSBest for open-source network monitoring
- 17SematextBest for log analytics with alerting
- 18Progress WhatsUp GoldBest for real-time network mapping
- 19ManageEngine Site24x7Best for website and uptime monitoring
- 20ObkioBest for active network performance testing
- 21Auvik Network ManagementBest for automated network mapping and inventory
- 22ExabeamBest for UEBA-based security detection
- 23Last9Best for SLO and reliability engineering
How I Evaluate Zabbix Alternatives
I split my evaluation into two layers: baseline requirements—SNMP, time-series metrics, alerting—and differentiators like AIOps, deployment flexibility, and MSP-grade multi-tenancy.
Core Functionality (Table Stakes For This List)
When I'm selecting tools for my list, I rank each one on a scale from 0 (does not offer the functionality) to 5 (excels in this area) for each core functionality listed below. Then, I calculate the tool's total score into a percentage. Each tool needs to achieve a minimum total score of 65% to be considered for inclusion.
- Infrastructure Monitoring: I check whether a tool covers servers, VMs, containers, and cloud instances across hybrid environments—not just one asset type in isolation.
- Metrics Collection & Storage: Collection methods matter here, from agents to SNMP to API-based ingestion, along with how long historical data is retained.
- Alerting & Notifications: I evaluate threshold configuration, escalation policies, and routing to channels like Slack, PagerDuty, or email for on-call teams.
- Dashboards & Visualization: Good dashboards go beyond static charts. I look for customizable views, topology maps, and drill-downs into specific hosts or services.
- Network Monitoring: Tools should support SNMP polling, device discovery, and availability tracking for switches, routers, and firewalls at a minimum.
- Integrations & Extensibility: I look at API quality, prebuilt connectors for ITSM and ChatOps tools, and whether there's a plugin or template ecosystem.
Once I have a list of tools that meet this criteria, I consider what sets each platform apart.
Differentiating Factors (What Sets Vendors Apart)
Here's how I compare and contrast different vendors:
Standout Features
AIOps capabilities make a real difference when you're monitoring thousands of hosts. Tools that baseline normal behavior and suppress noise save on-call teams from alert fatigue. I also evaluate whether a platform correlates logs with metrics in a single view, which speeds up root cause analysis during outages. For MSPs and large enterprises managing multiple clients or business units, multi-tenancy with granular RBAC determines whether one platform can replace several isolated instances.
Beyond Features
Deployment model matters a lot here. Some teams need a fully self-hosted option to meet internal security policies, while others want SaaS to avoid managing yet another on-prem stack. Pricing structure is equally important—per-host pricing can spiral fast when you're scaling into containers or auto-scaling cloud groups. I also evaluate how well a platform scales horizontally, especially for distributed teams running proxies across multiple data centers. Finally, migration support from Zabbix (documentation, import tools, community guides) can cut weeks off your transition.
Porquê procurar uma alternativa ao Zabbix?
Embora o Zabbix seja uma boa escolha para uma solução de monitorização de código aberto, existem vários motivos pelos quais alguns utilizadores procuram alternativas. Pode estar à procura de uma alternativa ao Zabbix porque…
- Precisa de um processo de configuração mais simples
- A sua equipa pretende painéis mais intuitivos
- Necessita de uma melhor integração com a nuvem
- A escalabilidade é uma preocupação para a sua empresa em crescimento
- Precisa de opções de alertas mais flexíveis
- A sua equipa necessita de uma ampla capacidade de personalização
Se alguma destas situações lhe parece familiar, veio ao sítio certo. A minha lista inclui várias opções de monitorização de código aberto mais adequadas para equipas que enfrentam estes desafios com o Zabbix e procuram soluções alternativas.
Funcionalidades
Eis algumas das principais funcionalidades do Zabbix, para o ajudar a comparar as ofertas das soluções alternativas:
- Monitorização detalhada: Monitoriza redes, servidores, serviços na nuvem e aplicações para recolher diversas métricas.
- Deteção de problemas em tempo real: Automatiza a deteção, a identificação de anomalias e os alertas personalizáveis para uma gestão proativa.
- Visualização e elaboração de relatórios: Oferece painéis personalizáveis, mapas geográficos e relatórios programados para uma representação eficaz dos dados.
- Integração e escalabilidade: Integra-se com vários sistemas informáticos e permite a monitorização distribuída através de proxies.
- Gestão de utilizadores e implementação: Disponibiliza o aprovisionamento de utilizadores no momento necessário, opções de implementação rápida e implementação automática de agentes.
- Formação e apoio da comunidade: Inclui programas de formação estruturados, envolvimento da comunidade e serviços profissionais para garantir a proficiência dos utilizadores.
- Monitorização com e sem agentes: Suporta a monitorização baseada em agentes e sem agentes através de vários protocolos.
- Monitorização sintética: Simula transações reais para aplicações Web, de modo a acompanhar as métricas de desempenho.
- Transformação de dados: Normaliza e otimiza os dados para uma gestão e análise eficientes.
- Deteção inteligente de problemas: Utiliza limiares inteligentes e aprendizagem automática para a deteção imediata de problemas e a previsão de tendências.
Próximos passos:
Se estiver a pesquisar uma solução de monitorização de código aberto, contacte gratuitamente um consultor da SoftwareSelect para obter recomendações.
Preenche um formulário e participa numa breve conversa, durante a qual analisam detalhadamente as suas necessidades. Em seguida, receberá uma lista restrita de software para analisar. Também o apoiarão durante todo o processo de compra, incluindo as negociações de preços.