

Gestire l'infrastruttura IT può essere un grattacapo, soprattutto quando gli strumenti attuali non sono del tutto adatti alle tue esigenze. Potresti utilizzare Zabbix, ma trovarlo carente sotto alcuni aspetti. Forse sono la complessità o la mancanza di integrazioni specifiche a spingerti a cercare delle alternative.
In base alla mia esperienza, trovare la giusta soluzione open source per il monitoraggio può fare una grande differenza per il tuo team. Dovrebbe semplificare il tuo lavoro, non complicarlo. Ho esaminato diverse opzioni per offrirti una panoramica imparziale delle migliori alternative a Zabbix.
In questo articolo troverai un'analisi dettagliata di ogni strumento, con particolare attenzione agli aspetti che li distinguono. Che tu stia cercando una migliore scalabilità o funzionalità specifiche, qui troverai quello che ti serve.
Che cos'è Zabbix?
Zabbix è una soluzione open source per il monitoraggio che tiene traccia delle prestazioni e della disponibilità dell'infrastruttura IT. Viene comunemente utilizzato da amministratori IT, ingegneri di rete e team DevOps per monitorare risorse di rete, server e applicazioni. Gli avvisi automatizzati, la visualizzazione dei dati e le funzionalità di scalabilità aiutano a identificare i problemi, ottimizzare l'utilizzo delle risorse e garantire l'affidabilità dei sistemi. Nel complesso, Zabbix offre una base solida per la gestione e l'osservazione degli ambienti IT.
Tabella di confronto delle alternative a Zabbix
Questa tabella di confronto riassume i dettagli sui prezzi delle mie principali alternative a Zabbix:
| Tool | Best For | Trial Info | Price | ||
|---|---|---|---|---|---|
| 1 | Ideale per il monitoraggio unificato | Prova gratuita di 30 giorni | Da $200/mese (fatturazione annuale) | Website | |
| 2 | Il miglior monitoraggio centralizzato per grandi imprese | Piano gratuito disponibile | Prezzo su richiesta | Website | |
| 3 | Ideale per il monitoraggio preconfigurato dei servizi cloud | Piano gratuito disponibile | Da $15/host/mese (fatturazione annuale) | Website | |
| 4 | Ideale per metriche in tempo reale senza configurazione | Prova gratuita di 14 giorni + piano gratuito + demo gratuita disponibile | A partire da $4.50/nodo/mese (fatturazione annuale) | Website | |
| 5 | Ideale per una logica di monitoraggio personalizzata e basata su plugin | Demo gratuita + piano gratuito disponibile | Da $2,595/100 nodi | Website | |
| 6 | Ideale per il pricing dell'osservabilità basato sull'utilizzo | Piano gratuito disponibile | Da $49/utente/mese | Website | |
| 7 | Ideale per il monitoraggio completo e conveniente | Piano gratuito + demo gratuita disponibile | Da $29/licenza/mese | Website | |
| 8 | Ideale per ELK gestito con configurazione guidata | Prova gratuita di 14 giorni + demo gratuita disponibile | Da $9/mese (fatturazione annuale) | Website | |
| 9 | Ideale per la scoperta automatica della rete SNMP | Demo gratuita disponibile | Gratuito | Website | |
| 10 | Ideale per l'osservabilità open-source | Prova gratuita di 30 giorni + demo gratuita disponibile | Da $49/mese | Website |


Perché fidarsi dei nostri consigli sui software
6,700+
Reviews
20
Industry experts
16+
Evaluation factors
14
Years
Il nostro team testa e recensisce software dal 2012. In quanto leader tecnologici noi stessi, sappiamo quanto sia difficile — e importante — scegliere il software giusto.
Per questa guida, abbiamo valutato gli strumenti attraverso test praticie ricerche indipendenti, assegnando un punteggio agli strumenti in base ai nostri criteri di selezione.
Le nostre recensioni riflettono il nostro giudizio editoriale umano, non un discorso di vendita.
Revisori esperti:
- Paulo Gardini MiguelDirettore tecnico
 Tim FisherVP dell'IA
 Gabriel RosasTech Lead e architetto software
 Christhian GruhnTech Lead e architetto della piattaforma

Recensioni delle migliori alternative a Zabbix
Di seguito sono riportati i miei riepiloghi dettagliati delle migliori alternative a Zabbix incluse nel mio elenco. Le mie recensioni offrono un’analisi approfondita delle funzionalità principali, dei pro e dei contro, delle integrazioni e dei casi d’uso ideali di ogni strumento, per aiutarti a trovare quello più adatto a te.
 Ideale per il monitoraggio unificato
- Prova gratuita di 30 giorni
- Da $200/mese (fatturazione annuale)
Visit WebsiteCustomer Rating:4.6/5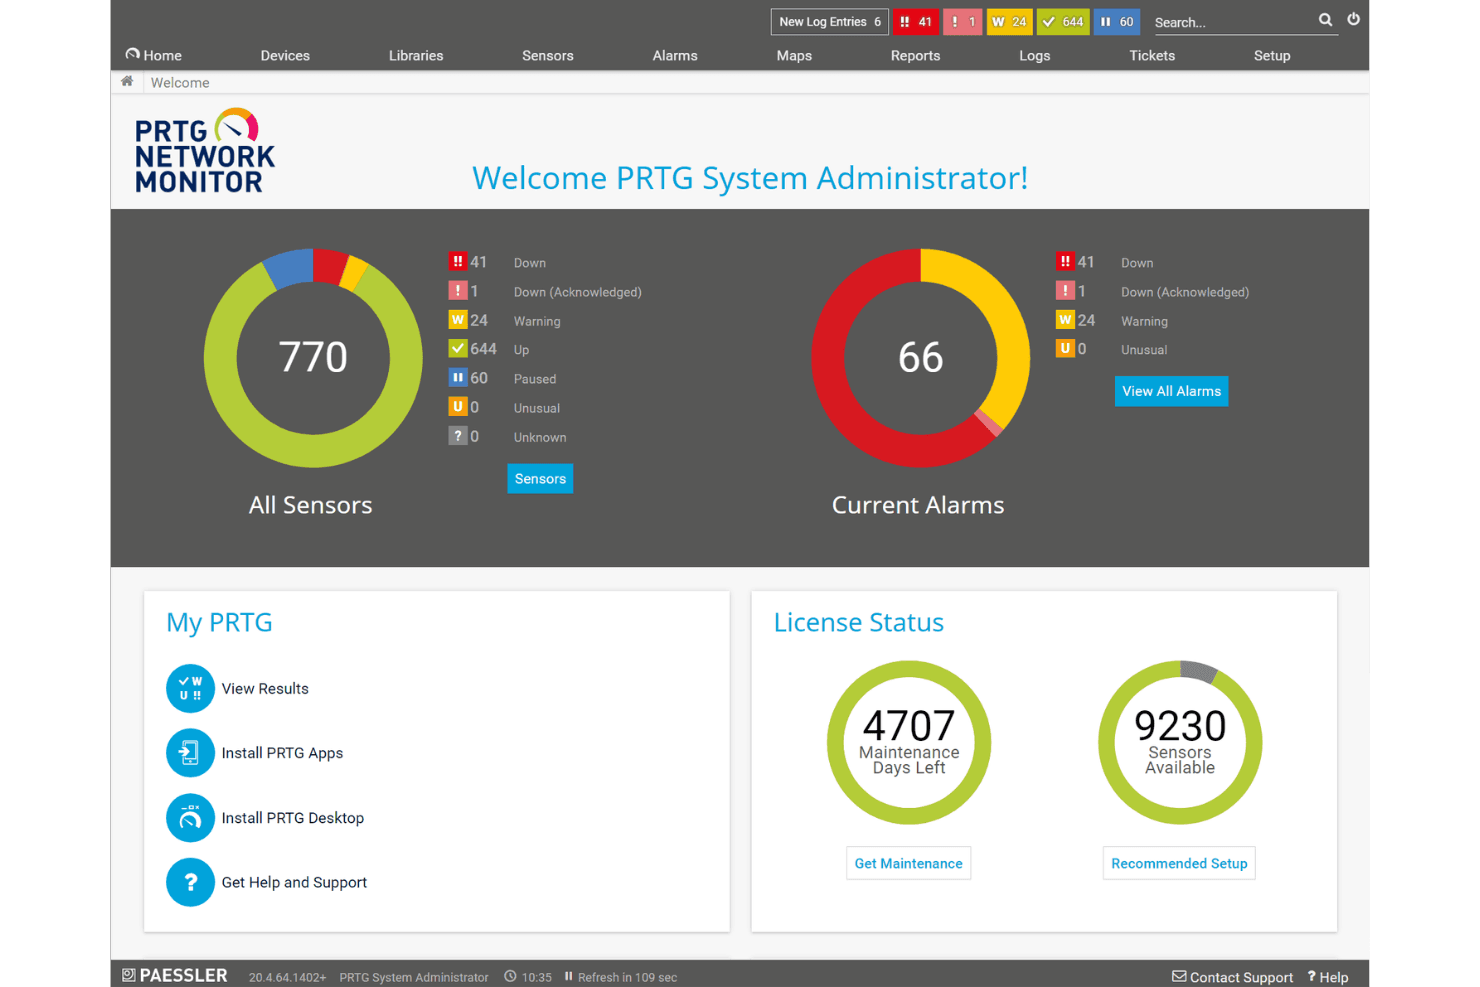
Paessler PRTG mostra una dashboard centralizzata di monitoraggio della rete con stato dei sensori, allarmi attuali e informazioni sulla licenza a colpo d’occhio. Paessler PRTG è una piattaforma di monitoraggio dell’infrastruttura tutto-in-uno che aiuta i team IT a tenere sotto controllo reti, server, applicazioni e servizi cloud da un’unica interfaccia, senza la complessità di configurazione manuale tipica degli strumenti open source come Zabbix.
Per chi è ideale Paessler PRTG?
È particolarmente adatto a team IT di medie dimensioni e operatori NOC che necessitano di una visibilità rapida e affidabile su ambienti misti on-premises e cloud, senza dover costruire da zero la soluzione di monitoraggio.
Perché Paessler PRTG è una buona alternativa a Zabbix
Ho incluso Paessler PRTG tra le mie migliori scelte perché offre una vera visibilità ibrida, risultato che con Zabbix richiederebbe un notevole lavoro di personalizzazione. L’architettura basata su sensori di PRTG copre SNMP, WMI, NetFlow, MQTT e Modbus TCP da un’unica interfaccia, senza la necessità di plugin separati o esportatori manuali. Apprezzo particolarmente il Multi-Platform Probe, che integra i dati di dispositivi OT e industriali negli stessi dashboard utilizzati per il monitoraggio cloud e di rete, rendendolo uno dei pochi strumenti in cui IT e OT convergono senza uno strato di integrazione separato.
Caratteristiche principali di Paessler PRTG
- Licenza basata su sensori: Ogni metrica monitorata conta come un sensore, permettendoti di personalizzare la copertura con costi prevedibili.
- Editor di mappe personalizzato: Crea mappe dell’infrastruttura in tempo reale tramite drag-and-drop per visualizzare rapidamente topologia e stato di salute.
- Notifiche multicanale: Imposta avvisi via email, notifiche push, richieste HTTP, o Microsoft Teams per flussi di risposta flessibili.
- Sonde remote: Distribuisci sonde su sedi o reti remote per abilitare il monitoraggio distribuito e centralizzato da un’unica dashboard.
Integrazioni Paessler PRTG
Paessler PRTG offre integrazioni native con Microsoft Teams, AWS, Azure, Google Cloud Platform, Siemens Industrial Edge e ServiceNow. È disponibile un’API per integrazioni personalizzate.
Pros and Cons
Pros:
- L’auto-discovery velocizza l’impostazione iniziale
- Si adatta a siti distribuiti tramite sonde remote
- Monitora OT e IT in un’unica piattaforma
Cons:
- Il costo aumenta rapidamente con il numero di sensori
- L’interfaccia web appare datata rispetto alle alternative più recenti
Learn more about Paessler PRTG: Il miglior monitoraggio centralizzato per grandi imprese
- Piano gratuito disponibile
- Prezzo su richiesta
Visit WebsiteCustomer Rating:4.7/5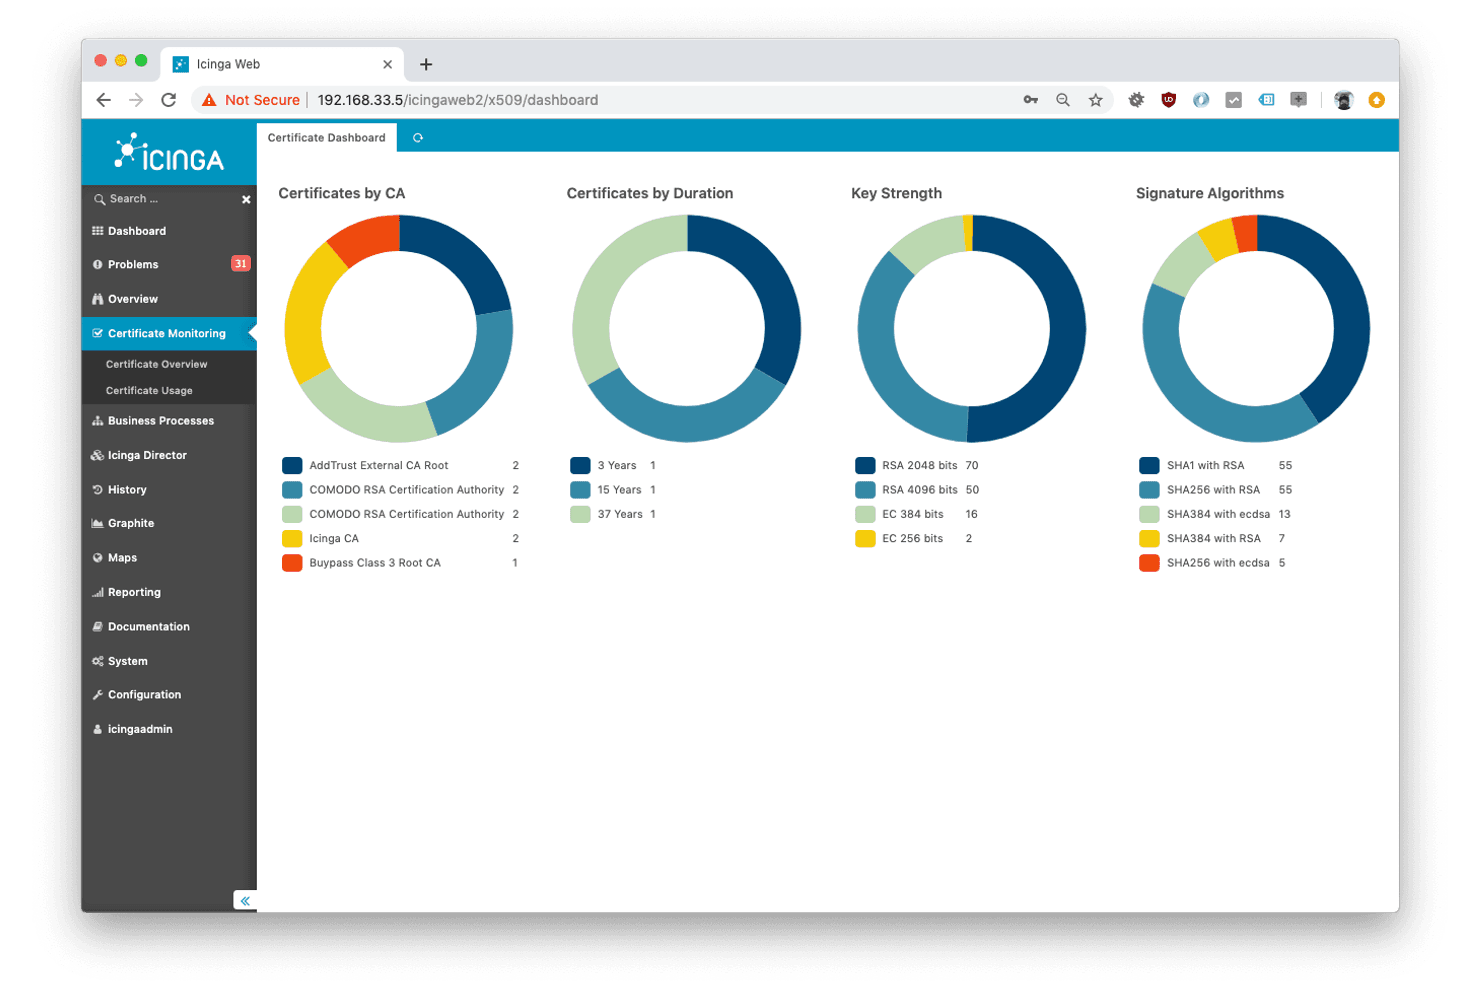
Icinga monitora la salute dell'infrastruttura e segnala problemi di prestazioni. Icinga è una soluzione di monitoraggio pensata per i professionisti IT che gestiscono infrastrutture complesse. Avvisi automatici, visualizzazione dei dati e funzionalità di scalabilità aiutano a identificare i problemi, ottimizzare l'uso delle risorse e garantire l'affidabilità del sistema.
Perché è una valida alternativa a Zabbix: La sua architettura modulare consente un'ampia personalizzazione e il monitoraggio self-hosted, rendendola particolarmente indicata per ambienti IT complessi. A differenza di Zabbix, Icinga offre opzioni di configurazione flessibili che si adattano alle esigenze specifiche della tua infrastruttura. La capacità di creare un sistema di monitoraggio efficiente per grandi ambienti distingue questa soluzione. Grazie all'attenzione alla scalabilità, puoi far crescere il monitoraggio man mano che si espande la tua infrastruttura.
Funzionalità e integrazioni principali:
Funzionalità includono monitoraggio distribuito, dashboard personalizzabili e avanzati sistemi di avviso. Il monitoraggio distribuito permette di supervisionare più sedi da un'unica piattaforma. Le dashboard personalizzabili ti danno il controllo su come visualizzare i tuoi dati.
Integrazioni includono Grafana, Prometheus, Elastic, AWS, Azure, Docker, Kubernetes, Puppet, Ansible, Chef e altri ancora.
Pros and Cons
Pros:
- Soluzione altamente scalabile
- Configurazione flessibile con controllo molto dettagliato
- Ottimo supporto per ambienti complessi e distribuiti
Cons:
- Modelli integrati limitati
- Configurazione manuale complessa
Learn more about Icinga: Ideale per il monitoraggio preconfigurato dei servizi cloud
- Piano gratuito disponibile
- Da $15/host/mese (fatturazione annuale)
Visit WebsiteCustomer Rating:4.5/5
Datadog analizza metriche, log e tracce nei sistemi cloud. Datadog è una piattaforma di monitoraggio e analisi utilizzata dai team IT e DevOps per supervisionare applicazioni e infrastrutture cloud. Aiuta le aziende a tracciare metriche di prestazione, log e tracce per garantire l'affidabilità dei sistemi.
Perché è una buona alternativa a Zabbix: Le capacità di integrazione cloud di Datadog lo rendono ideale per i team che utilizzano diversi servizi cloud. La sua piattaforma unificata consente di monitorare applicazioni, log e metriche in un unico posto, caratteristica essenziale per gli ambienti IT moderni. L'attenzione agli ambienti cloud-native offre flessibilità e semplicità nella gestione delle risorse in cloud.
Funzionalità principali e integrazioni:
Funzionalità includono dashboard interattive in tempo reale, rilevamento di anomalie e avvisi basati su machine learning. Le dashboard in tempo reale offrono una panoramica chiara dello stato del sistema. Il rilevamento di anomalie consente di individuare modelli insoliti prima che diventino problemi.
Integrazioni includono AWS, Azure, Google Cloud, Docker, Kubernetes, Slack, PagerDuty, GitHub, Jira, Terraform e altro ancora.
Pros and Cons
Pros:
- Ampie integrazioni tra strumenti cloud e SaaS
- Piattaforma di monitoraggio unificata
- Monitoraggio delle applicazioni e approfondimenti
Cons:
- I costi possono aumentare rapidamente su larga scala
- Prezzi complessi e monitoraggio dell'utilizzo
 Ideale per metriche in tempo reale senza configurazione
- Prova gratuita di 14 giorni + piano gratuito + demo gratuita disponibile
- A partire da $4.50/nodo/mese (fatturazione annuale)
Visit WebsiteCustomer Rating:4.8/5
Netdata monitora le prestazioni del sistema con informazioni sulla salute in tempo reale. Netdata è una soluzione di monitoraggio progettata per professionisti IT e team DevOps che necessitano di dati in tempo reale per gestire la propria infrastruttura. Fornisce informazioni sulle prestazioni del sistema e sui parametri di stato, aiutando i team a identificare e risolvere rapidamente i problemi.
Perché è una buona alternativa a Zabbix: Con il monitoraggio in tempo reale, dashboard interattive e visualizzazioni dinamiche dei dati, Netdata offre informazioni immediate per supportare decisioni rapide. A differenza di Zabbix, Netdata offre rappresentazioni visive dei dati più intuitive, facilitando ai team la comprensione delle prestazioni del sistema. L'attenzione della piattaforma sulle analisi in tempo reale consente di individuare i problemi non appena si verificano. L'interfaccia utente intuitiva e facile da usare assicura un'esperienza più fluida nel monitoraggio e nella diagnosi dei problemi.
Funzionalità principali e integrazioni:
Funzionalità includono rilevamento automatico delle anomalie, allarmi personalizzabili e metriche dettagliate sulla salute del sistema. È possibile accedere a un'ampia gamma di funzioni di monitoraggio dell'infrastruttura pensate per esigenze diverse. La piattaforma è progettata per offrire informazioni continue senza sovraccaricare di dati inutili.
Integrazioni includono AWS, Azure, Google Cloud, Kubernetes, Docker, Slack, PagerDuty, Opsgenie, Prometheus, Grafana e altro ancora.
Pros and Cons
Pros:
- Metriche di sistema in tempo reale, al secondo
- Rilevamento automatico senza configurazione
- Agent leggero con basso consumo di risorse
Cons:
- Memorizzazione limitata dei dati storici
- Le funzionalità avanzate richiedono conoscenze tecniche
Learn more about Netdata: Ideale per una logica di monitoraggio personalizzata e basata su plugin
- Demo gratuita + piano gratuito disponibile
- Da $2,595/100 nodi
Visit WebsiteCustomer Rating:4.3/5
Nagios monitora l’uptime dei sistemi e avvisa i team di eventuali problemi di prestazioni. Nagios è una soluzione di monitoraggio utilizzata principalmente da professionisti IT e amministratori di sistema per tenere traccia di sistemi di rete, server e applicazioni. Avvisi automatici, visualizzazione dei dati e funzionalità di scalabilità aiutano a identificare i problemi, ottimizzare le risorse e garantire l'affidabilità dei sistemi.
Perché è una valida alternativa a Zabbix: Nagios offre una vasta gamma di plugin che possono essere personalizzati per monitorare diversi ambienti. Questa flessibilità lo rende ideale per i team con infrastrutture IT uniche o complesse. Puoi creare e implementare plugin per soddisfare diverse esigenze di monitoraggio, migliorando così l'adattabilità.
Funzionalità e integrazioni principali:
Funzionalità includono avvisi in tempo reale, raccolta dati sulle prestazioni e dashboard personalizzabili. Gli avvisi in tempo reale ti tengono informato su eventuali problemi appena si verificano. Le dashboard personalizzabili ti permettono di creare una visualizzazione di monitoraggio adatta alle tue preferenze.
Integrazioni includono AWS, Azure, VMware, Docker, Slack, PagerDuty, ServiceNow, Splunk, Elasticsearch, Jira e altro ancora.
Pros and Cons
Pros:
- Strumento maturo e open-source
- Ampia personalizzazione per la logica di monitoraggio
- Grande ecosistema e plugin della community e API
Cons:
- Interfaccia datata
- Configurazione e manutenzione manuali che richiedono tempo
Learn more about Nagios: Ideale per il pricing dell'osservabilità basato sull'utilizzo
- Piano gratuito disponibile
- Da $49/utente/mese
Visit WebsiteCustomer Rating:4.3/5
New Relic individua rapidamente i problemi di prestazioni delle app. New Relic è uno strumento di monitoraggio delle prestazioni delle applicazioni utilizzato da sviluppatori e team IT per tracciare e ottimizzare le prestazioni delle applicazioni. Ti aiuta a ottenere informazioni dettagliate sulle tue applicazioni, infrastrutture ed esperienza del cliente.
Perché è una valida alternativa a Zabbix: New Relic fornisce approfondimenti dettagliati sulle prestazioni delle applicazioni con particolare attenzione all’esperienza utente. Le sue analisi in tempo reale ti permettono di monitorare costantemente lo stato di salute e le prestazioni delle applicazioni. Il modello di prezzo basato sull’utilizzo offre flessibilità ai team che desiderano gestire efficacemente i costi. Questo modello permette al tuo team di aumentare il monitoraggio in base all’utilizzo, ottimizzando il rapporto costo-efficienza.
Funzionalità e integrazioni principali:
Funzionalità includono analisi in tempo reale, tracciamento distribuito e funzionalità AIOps. Le analisi in tempo reale offrono un’immediata comprensione delle prestazioni applicative. Il tracciamento distribuito ti aiuta a seguire le richieste tra i servizi per identificare i colli di bottiglia.
Integrazioni includono AWS, Azure, Google Cloud, Kubernetes, Docker, Slack, PagerDuty, Jira, ServiceNow, GitHub e altri.
Pros and Cons
Pros:
- Flessibilità del pricing basato sull’utilizzo
- Monitoraggio efficace delle prestazioni applicative
- Focus sull’esperienza utente
Cons:
- I costi mensili variano in base all’ingestione e al volume delle query dei dati
- Interfaccia utente ricca di funzionalità
Learn more about New Relic: Ideale per il monitoraggio completo e conveniente
- Piano gratuito + demo gratuita disponibile
- Da $29/licenza/mese

Better Stack monitora uptime e affidabilità. Better Stack è una piattaforma di osservabilità utilizzata da professionisti IT e team DevOps per monitorare infrastrutture e applicazioni. Si concentra sulla gestione degli incidenti, sul monitoraggio della disponibilità e sulla gestione dei log per aiutare i team a mantenere l'affidabilità dei sistemi.
Perché è una buona alternativa a Zabbix: Il suo prezzo conveniente lo rende una scelta ideale per gestire i costi mantenendo alta la qualità del monitoraggio. A differenza di Zabbix, Better Stack offre tracciamento degli errori guidato da AI e un data warehouse serverless ClickHouse, che permette di analizzare i dati senza vincoli del fornitore. L'interfaccia intuitiva della piattaforma semplifica i processi di monitoraggio per il tuo team. Funzionalità come la gestione degli incidenti e il monitoraggio della disponibilità garantiscono un controllo approfondito a un costo inferiore.
Funzionalità di spicco e integrazioni:
Funzionalità includono analisi automatica delle cause, strumenti di indagine visiva e notifiche di allerta illimitate. L'analisi automatica delle cause aiuta il tuo team a identificare e risolvere rapidamente i problemi. Gli strumenti di indagine visiva offrono una panoramica chiara delle richieste lente e degli errori.
Integrazioni includono Slack, Microsoft Teams, Jira, OpenTelemetry, Prometheus, AWS, Azure, Google Cloud, GitHub, PagerDuty e altri.
Pros and Cons
Pros:
- Unisce monitoraggio della disponibilità, logging e risposta agli incidenti
- Funzionalità di tracciamento errori basate su AI
- Interfaccia utente semplice e moderna
Cons:
- Funzionalità limitate per grandi aziende
- Analisi avanzata limitata
Learn more about Better Stack: Ideale per ELK gestito con configurazione guidata
- Prova gratuita di 14 giorni + demo gratuita disponibile
- Da $9/mese (fatturazione annuale)
Visit WebsiteCustomer Rating:4.5/5
Logit.io aggrega i dati di osservabilità in un unico posto. Logit.io è una piattaforma di osservabilità gestita, progettata per professionisti IT e team DevOps, focalizzata sulla gestione dei log e sul monitoraggio delle prestazioni applicative. Centralizza log, metriche e tracce, aiutando i team a monitorare e analizzare dati provenienti da varie fonti.
Perché è una buona alternativa a Zabbix: Grazie all'enfasi sulla facilità d'uso, Logit.io è accessibile per i team che cercano soluzioni di monitoraggio semplici. La sua interfaccia intuitiva con dashboard personalizzabili aiuta a visualizzare i dati. L'analisi dei dati in tempo reale e le funzionalità di alerting avanzate consentono di restare sempre aggiornati sulle problematiche senza complessità. I servizi gestiti della piattaforma significano meno tempo speso per configurazione e manutenzione.
Funzionalità e integrazioni principali:
Funzionalità includono analisi dei dati in tempo reale, alerting avanzato e dashboard personalizzabili. L'analisi dei dati in tempo reale fornisce informazioni aggiornate immediatamente. L'alerting avanzato ti tiene informato su potenziali problemi non appena si presentano.
Integrazioni includono OpenSearch, Grafana, Prometheus, AWS, Azure, Google Cloud, Elasticsearch, Logstash, Kibana, OpenTelemetry e altro ancora.
Pros and Cons
Pros:
- Ambienti ELK e OpenSearch gestiti
- Interfaccia intuitiva
- Configurazione guidata e onboarding semplificato
Cons:
- Gli aggiornamenti gestiti possono talvolta essere in ritardo
- Meno personalizzabile rispetto agli stack autogestiti
Learn more about Logit.io: Ideale per la scoperta automatica della rete SNMP
- Demo gratuita disponibile
- Gratuito

LibreNMS mappa le metriche di prestazione della rete. LibreNMS è uno strumento di monitoraggio di rete utilizzato da amministratori e professionisti IT per monitorare e gestire dispositivi di rete. Fornisce informazioni sulle prestazioni della rete e aiuta a mantenere operative le attività in modo efficiente.
Perché è una valida alternativa a Zabbix: LibreNMS supporta una varietà di protocolli di rete per abilitare il rilevamento e il monitoraggio dei dispositivi. Le sue funzionalità di scoperta automatica della rete facilitano al tuo team la gestione di una vasta gamma di dispositivi. Lo strumento offre avvisi personalizzabili, così puoi rimanere aggiornato sui problemi di rete in tempo reale. Il suo focus sulla scoperta di rete ti permette di gestire dispositivi in ambienti dinamici in modo efficiente.
Funzionalità e integrazioni principali:
Funzionalità includono grafici dettagliati sulle prestazioni, avvisi personalizzabili e un'interfaccia ottimizzata per dispositivi mobili. I grafici dettagliati sulle prestazioni ti aiutano a visualizzare efficacemente i dati di rete. Gli avvisi personalizzabili ti permettono di ricevere solo le notifiche più rilevanti.
Integrazioni includono Slack, PagerDuty, Opsgenie, Microsoft Teams, VictorOps, Webex Teams, Mattermost, Discord e altri.
Pros and Cons
Pros:
- Scoperta automatica dei dispositivi di rete tramite SNMP
- Ottimo supporto per una vasta gamma di hardware di rete
- Aggiornamenti e plugin guidati dalla community
Cons:
- Richiede conoscenza SNMP per la configurazione iniziale
- Capacità limitate di monitoraggio di applicazioni e server
Learn more about LibreNMS: 10Ideale per l'osservabilità open-source
SigNoz
- Prova gratuita di 30 giorni + demo gratuita disponibile
- Da $49/mese

SigNoz rileva i colli di bottiglia nelle prestazioni delle applicazioni. SigNoz è una piattaforma di osservabilità che aiuta sviluppatori e team DevOps a monitorare e risolvere i problemi delle applicazioni. Fornisce approfondimenti dettagliati sulle prestazioni dell'applicazione e aiuta a identificare e risolvere le criticità.
Perché è una buona alternativa a Zabbix: SigNoz si concentra nel fornire approfondimenti a livello applicativo, rendendolo adatto ai team che puntano sulle prestazioni delle applicazioni. I suoi strumenti open-source di osservabilità rendono più semplice per i team personalizzare ed estendere le funzionalità di monitoraggio. SigNoz offre funzioni come il tracing distribuito e la gestione dei log per migliorare la visibilità. Grazie alla sua natura open-source, puoi adattare la piattaforma alle tue esigenze specifiche.
Caratteristiche e integrazioni principali:
Funzionalità includono tracing distribuito, dashboard personalizzabili e gestione dei log in tempo reale. Il tracing distribuito ti aiuta a seguire le richieste tra servizi diversi e a individuare i colli di bottiglia. Le dashboard personalizzabili ti permettono di visualizzare le metriche chiave nel modo più adatto al flusso di lavoro del tuo team.
Integrazioni includono Prometheus, Grafana, OpenTelemetry, Kubernetes, Docker, AWS, Azure, Google Cloud, Elastic, Slack e altri.
Pros and Cons
Pros:
- Osservabilità open-source con pieno controllo sui dati
- Approfondimenti applicativi nativi
- Tracing e metriche OpenTelemetry
Cons:
- Richiede competenze tecniche e operative per la gestione
- Ecosistema più piccolo rispetto alle piattaforme commerciali
Learn more about SigNoz:
Altre alternative a Zabbix
Ecco alcune ulteriori alternative a Zabbix che non sono state incluse nel mio elenco, ma che vale comunque la pena prendere in considerazione:
- 11CheckmkIdeale per il monitoraggio ad alte prestazioni su larga scala
- 12Auvik Network ManagementIdeale per la mappatura automatica della rete e l'inventario
- 13ExabeamIdeale per il rilevamento della sicurezza basato su UEBA
- 14Last9Ideale per SLO e ingegneria dell'affidabilità
Come Valuto le Alternative a Zabbix
Divido la mia valutazione in due livelli: requisiti di base—SNMP, metriche temporali, alerting—e fattori differenzianti come AIOps, flessibilità di implementazione e multi-tenancy di livello MSP.
Funzionalità Core (Requisiti Fondamentali per Questa Lista)
Quando seleziono gli strumenti per la mia lista, valuto ciascuno su una scala da 0 (non offre la funzionalità) a 5 (eccelle in quest’area) per ogni funzionalità di base elencata sotto. Successivamente, trasformo il punteggio totale dello strumento in una percentuale. Ogni strumento deve ottenere un punteggio totale minimo del 65% per poter essere preso in considerazione.
- Monitoraggio dell’Infrastruttura: Verifico che uno strumento copra server, VM, container e istanze cloud in ambienti ibridi—non solo una tipologia di asset isolata.
- Raccolta e Archiviazione delle Metriche: I metodi di raccolta sono importanti, dagli agenti a SNMP fino all’ingestione basata su API, insieme a quanto a lungo vengono conservati i dati storici.
- Alerting e Notifiche: Valuto la configurazione delle soglie, le politiche di escalation e il routing verso canali come Slack, PagerDuty o email per i team reperibili.
- Dashboard e Visualizzazione: Buone dashboard vanno oltre i grafici statici. Cerco viste personalizzabili, mappe topologiche e la possibilità di approfondire host o servizi specifici.
- Monitoraggio di Rete: Gli strumenti devono supportare il polling SNMP, la scoperta dei dispositivi e il monitoraggio della disponibilità di switch, router e firewall almeno come base.
- Integrazioni ed Estendibilità: Esamino la qualità delle API, i connettori predefiniti per strumenti ITSM e ChatOps, e se esiste un ecosistema di plugin o template.
Una volta che dispongo di una lista di strumenti che soddisfano questi criteri, considero ciò che distingue ciascuna piattaforma.
Fattori Differenzianti (Cosa Distingue i Fornitori)
Ecco come confronto i diversi fornitori:
Funzionalità Distintive
Le capacità AIOps fanno una vera differenza quando si monitorano migliaia di host. Gli strumenti che creano una baseline del comportamento normale e sopprimono il rumore salvano i team reperibili dalla fatica degli alert. Valuto anche se una piattaforma correla log e metriche in una vista unica, velocizzando l’analisi della causa radice durante i down. Per MSP ed enterprise che gestiscono più clienti o divisioni, la multi-tenancy con RBAC granulare determina se una piattaforma può sostituire più istanze isolate.
Oltre le Funzionalità
Il modello di implementazione qui conta molto. Alcuni team necessitano di un’opzione totalmente self-hosted per rispettare le politiche di sicurezza interne, mentre altri preferiscono il SaaS per evitare di gestire l’ennesima infrastruttura on-prem. Anche la struttura dei prezzi è fondamentale—la tariffazione per host può salire rapidamente quando si scala verso container o gruppi cloud auto-scalanti. Valuto inoltre quanto una piattaforma scala orizzontalmente, soprattutto per i team distribuiti che gestiscono proxy tra più data center. Infine, il supporto alla migrazione da Zabbix (documentazione, tool di importazione, guide della community) può ridurre di settimane la transizione.
Perché cercare un'alternativa a Zabbix?
Sebbene Zabbix sia una buona scelta per una soluzione open source di monitoraggio, ci sono diversi motivi per cui alcuni utenti cercano delle alternative. Potresti essere alla ricerca di un'alternativa a Zabbix perché…
- Hai bisogno di un processo di configurazione più semplice
- Il tuo team desidera dashboard più intuitive
- Hai bisogno di una migliore integrazione con il cloud
- La scalabilità è una preoccupazione per la tua azienda in crescita
- Hai bisogno di opzioni di avviso più flessibili
- Il tuo team necessita di ampie possibilità di personalizzazione
Se ti riconosci in una di queste situazioni, sei nel posto giusto. Il mio elenco contiene diverse opzioni open source per il monitoraggio, più adatte ai team che affrontano queste difficoltà con Zabbix e cercano soluzioni alternative.
Funzionalità
Ecco alcune delle funzionalità principali di Zabbix, che ti aiuteranno a mettere a confronto ciò che offrono le soluzioni alternative:
- Monitoraggio dettagliato: Monitora reti, server, servizi cloud e applicazioni per raccogliere metriche diverse.
- Rilevamento dei problemi in tempo reale: Automatizza il rilevamento, l'identificazione delle anomalie e gli avvisi personalizzabili per una gestione proattiva.
- Visualizzazione e reportistica: Offre dashboard personalizzabili, mappe geografiche e report pianificati per una rappresentazione efficace dei dati.
- Integrazione e scalabilità: Si integra con vari sistemi IT e supporta il monitoraggio distribuito tramite proxy.
- Gestione degli utenti e distribuzione: Offre la creazione tempestiva degli utenti, opzioni di distribuzione rapida e distribuzione automatica degli agenti.
- Formazione e supporto della community: Include programmi di formazione strutturati, coinvolgimento della community e servizi professionali per garantire la competenza degli utenti.
- Monitoraggio con e senza agenti: Supporta sia il monitoraggio basato su agenti sia quello senza agenti tramite vari protocolli.
- Monitoraggio sintetico: Simula transazioni reali per le applicazioni web al fine di monitorare le metriche delle prestazioni.
- Trasformazione dei dati: Normalizza e ottimizza i dati per una gestione e un'analisi efficienti.
- Rilevamento intelligente dei problemi: Utilizza soglie intelligenti e l'apprendimento automatico per rilevare immediatamente i problemi e prevedere le tendenze.
Qual è il prossimo passo:
Se stai cercando una soluzione di monitoraggio open source, contatta gratuitamente un consulente di SoftwareSelect per ricevere consigli.
Compili un modulo e svolgi una breve conversazione durante la quale verranno analizzate nel dettaglio le tue esigenze. In seguito riceverai una lista ristretta di software da esaminare. Ti accompagneranno inoltre durante l'intero processo di acquisto, comprese le negoziazioni sui prezzi.