

As melhores alternativas ao Nagios ajudam as equipas a monitorizar sistemas sem terem de lidar com requisitos de configuração complexos ou limites de escalabilidade. Disponibilizam painéis mais claros, configurações mais simples e integrações flexíveis que facilitam o acompanhamento do desempenho em servidores, redes e aplicações.
Muitas organizações começam a procurar alternativas depois de enfrentarem problemas como a configuração de extensões do Nagios que não se integram corretamente, a perda de tempo na resolução de mensagens de erro crípticas ou a chegada aos limites de desempenho à medida que as necessidades de monitorização aumentam. Estes desafios tornam as operações mais lentas e dificultam a manutenção da visibilidade em grande escala por parte das equipas de TI.
Testei plataformas de monitorização em ambientes de produção reais, trabalhei com equipas que estavam a migrar de implementações Nagios antigas e avaliei o desempenho destas ferramentas em infraestruturas híbridas e na nuvem. Essas experiências mostraram-me quais as soluções que reduzem efetivamente a sobrecarga da monitorização e quais criam novas complexidades.
Neste guia, verá quais as alternativas ao Nagios que proporcionam uma configuração mais simples, melhor escalabilidade e informações mais úteis, para que a sua equipa se possa concentrar na resolução de problemas em vez de lutar contra o sistema de monitorização.
O que é o Nagios?
O Nagios é uma plataforma de código aberto de monitorização e gestão de redes, concebida para a monitorização de redes e sistemas. Os profissionais de TI e os administradores de sistemas utilizam geralmente o Nagios para vigiar a infraestrutura crítica e garantir o bom funcionamento das operações.
As suas capacidades de alertas, elaboração de relatórios e monitorização ajudam a detetar problemas, analisar o desempenho e gerir eficazmente os recursos da rede. De forma geral, o Nagios proporciona valor ao ajudar a sua equipa a manter a fiabilidade dos sistemas e a minimizar o tempo de inatividade.
Tabela comparativa das alternativas ao Nagios
Esta tabela comparativa resume os detalhes de preços das minhas principais escolhas de alternativas ao Nagios:
Score legend (out of 5)
- Excellent4.5–5
- Good4–4.4
- Average3–3.9
- Below average2–2.9
- Poor1–1.9
Sorted by: Default
| Tool | Starting Price | Website | |||||||
|---|---|---|---|---|---|---|---|---|---|
Best for unified device and sensor monitoring | 3.7 out of 5 | 4 | 4 | 4 | 3 | 4 | 3 | $200/month Free plan + 30-day free trial available | Website |
Best for complex IT infrastructures | 3.3 out of 5 | 3 | 3 | 3 | 4 | 4 | 3 | $1,400/year Free plan + 60-day free trial available | Website |
Best for multi-cloud monitoring | 3.7 out of 5 | 4 | 4 | 3 | 4 | 4 | 3 | $10/month Free plan + 30-day trial + demo available | Website |
Best for web application monitoring | 3.5 out of 5 | 4 | 1 | 4 | 4 | 4 | 4 | $13.33/month Free plan + 30-day free trial + free demo available | Website |
Best for plug-and-play setup | 3.0 out of 5 | 3 | 2 | 2 | 4 | 3 | 4 | Pricing upon request Free plan + demo available | Website |
Best for full-stack observability | 3.8 out of 5 | 4 | 4 | 4 | 4 | 4 | 3 | $2.80/month Free plan + 14-day free trial + free demo available | Website |
Best for graphing capabilities | 3.0 out of 5 | 3 | 2 | 3 | 3 | 4 | 3 | Pricing upon request Not available | Website |
Best for AIOps and observability | 3.5 out of 5 | 3 | 4 | 3 | 4 | 4 | 3 | Pricing upon request Free demo available | Website |
Best for end-to-end monitoring | 4.3 out of 5 | 4 | 4 | 4 | 5 | 5 | 4 | €283/month Free plan + 30-day trial + demo available | Website |
Best for distributed networks | 3.3 out of 5 | 3 | 3 | 3 | 4 | 4 | 3 | $6,000/year Free plan available | Website |


Why Trust Our Software Recommendations
6,700+
Reviews
20
Industry experts
16+
Evaluation factors
14
Years
Our team has been testing and reviewing software since 2012. As tech leaders ourselves, we know how difficult—and important—it is to choose the right software.
For this guide, we evaluated tools using hands-on testing and independent research, scoring tools using our selection criteria.
Our reviews reflect our human editorial judgment, not a sales pitch.
Expert reviewers:
- Paulo Gardini MiguelTech Director
 Tim FisherVP of AI
 Gabriel RosasTech Lead & Software Architect
 Christhian GruhnTech Lead & Platform Architect

Avaliações das melhores alternativas ao Nagios
Apresentamos abaixo os meus resumos detalhados das melhores alternativas ao Nagios que entraram na minha lista. As minhas avaliações analisam detalhadamente as principais funcionalidades, vantagens & desvantagens, integrações e casos de utilização ideais de cada ferramenta, para ajudar a encontrar a melhor opção para si.
 Best for unified device and sensor monitoring
- Free plan + 30-day free trial available
- From $200/month (billed annually)
Visit WebsiteCustomer Rating:4.6/5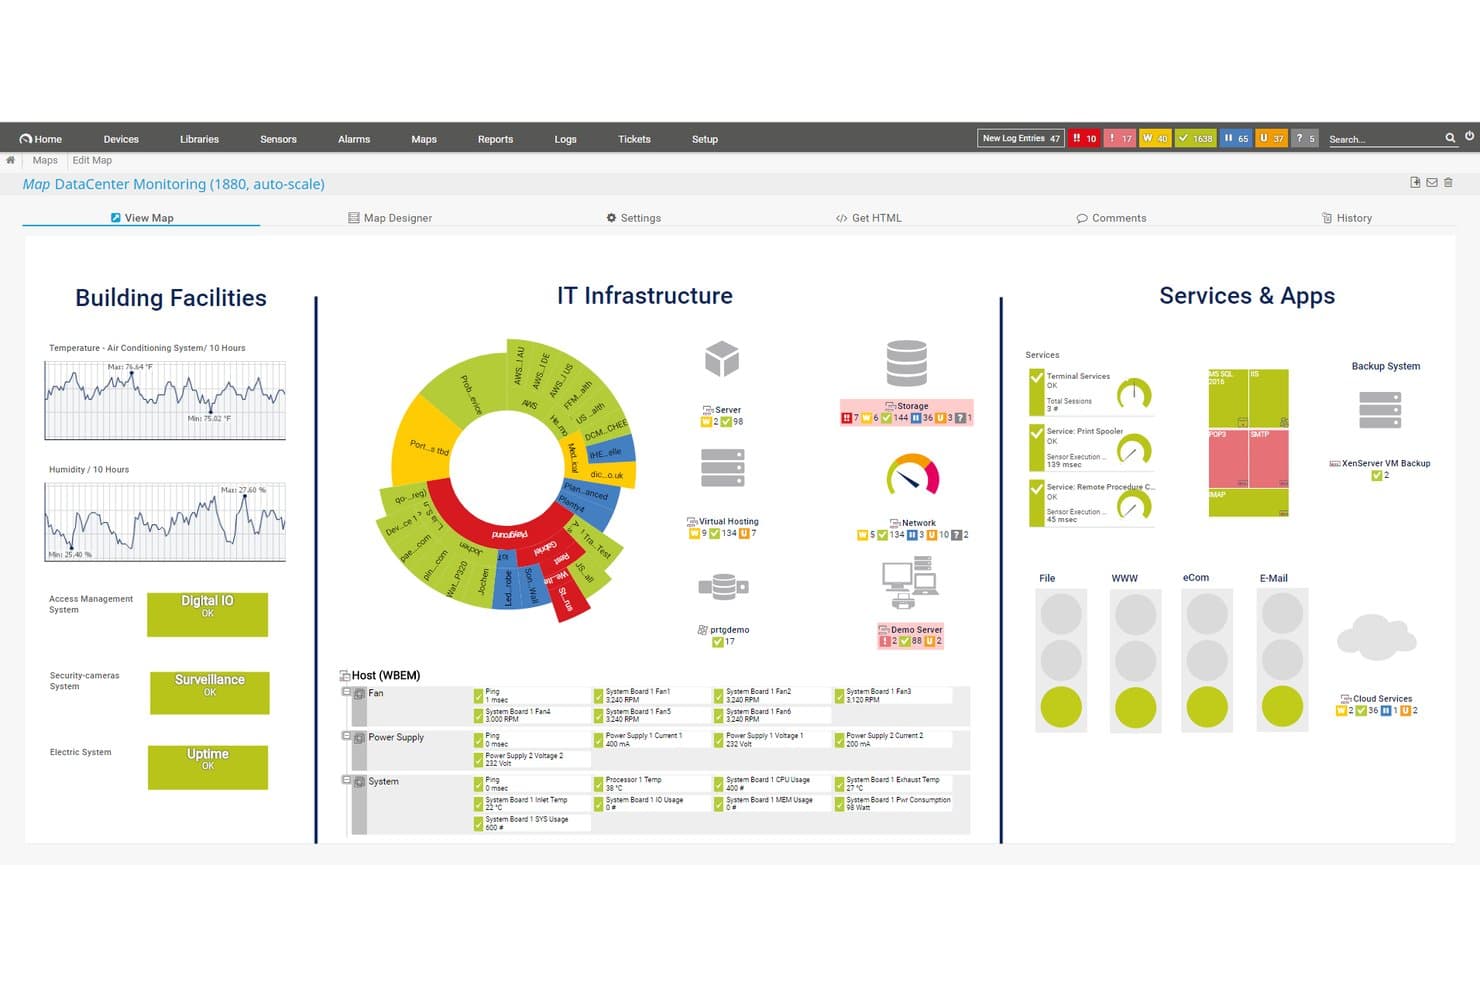
Paessler PRTG offers a customizable data center monitoring map displaying building facilities, IT infrastructure, and services and apps in a unified dashboard view. Paessler PRTG is an on-premises network monitoring platform that gives IT teams and system administrators a single place to monitor servers, network devices, applications, and OT/IoT infrastructure using over 250 preconfigured sensors and agentless auto-discovery.
Who Is Paessler PRTG Best For?
PRTG is a strong fit for IT teams managing mixed on-premises environments who need broad device and sensor coverage without building monitoring from scratch.
Why I Picked Paessler PRTG
I picked PRTG as one of the best because it brings everything into a single monitoring layer without requiring you to build sensor coverage from scratch. What I really like is how its 250+ preconfigured sensors span servers, network devices, virtual environments, and OT/IoT gear, so you're not stitching together separate tools to get a full picture. The adaptive baseline anomaly detection also adds real value: PRTG automatically flags unusual behavior without you manually defining every threshold.
Paessler PRTG Key Features
- Multi-channel alerting: Sends notifications via email, SMS, push, Microsoft Teams, Slack, syslog, and SNMP traps, with configurable escalation levels and schedules.
- Distributed probe monitoring: Deploys classic remote probes and multi-platform probes to monitor subnetworks behind firewalls and distribute load across systems.
- Custom sensor creation: Builds custom sensors using PowerShell, Python, SSH Script, REST Custom, and HTTP Push Data to monitor what preconfigured sensors don't cover.
- Scheduled and on-demand reporting: Generates sensor-level and summary reports on a schedule or on demand, with historic data exports in XML, CSV, HTML, and PDF formats.
Paessler PRTG Integrations
Paessler PRTG has native integrations with Microsoft Teams and Slack, plus integrations with NetBrain, Martello iQ, and Siemon. REST API v2, HTTP API v1, and custom sensors support additional integrations.
Pros and Cons
Pros:
- Dashboards make network health visible
- Broad device coverage consolidates monitoring
- Prebuilt sensors reduce manual Nagios checks
Cons:
- Historical data averaging limits trend detail
- Dated maps constrain operational views
Learn more about Paessler PRTG: Best for complex IT infrastructures
- Free plan + 60-day free trial available
- From $1,400/year (billed annually)
Visit WebsiteCustomer Rating:4.7/5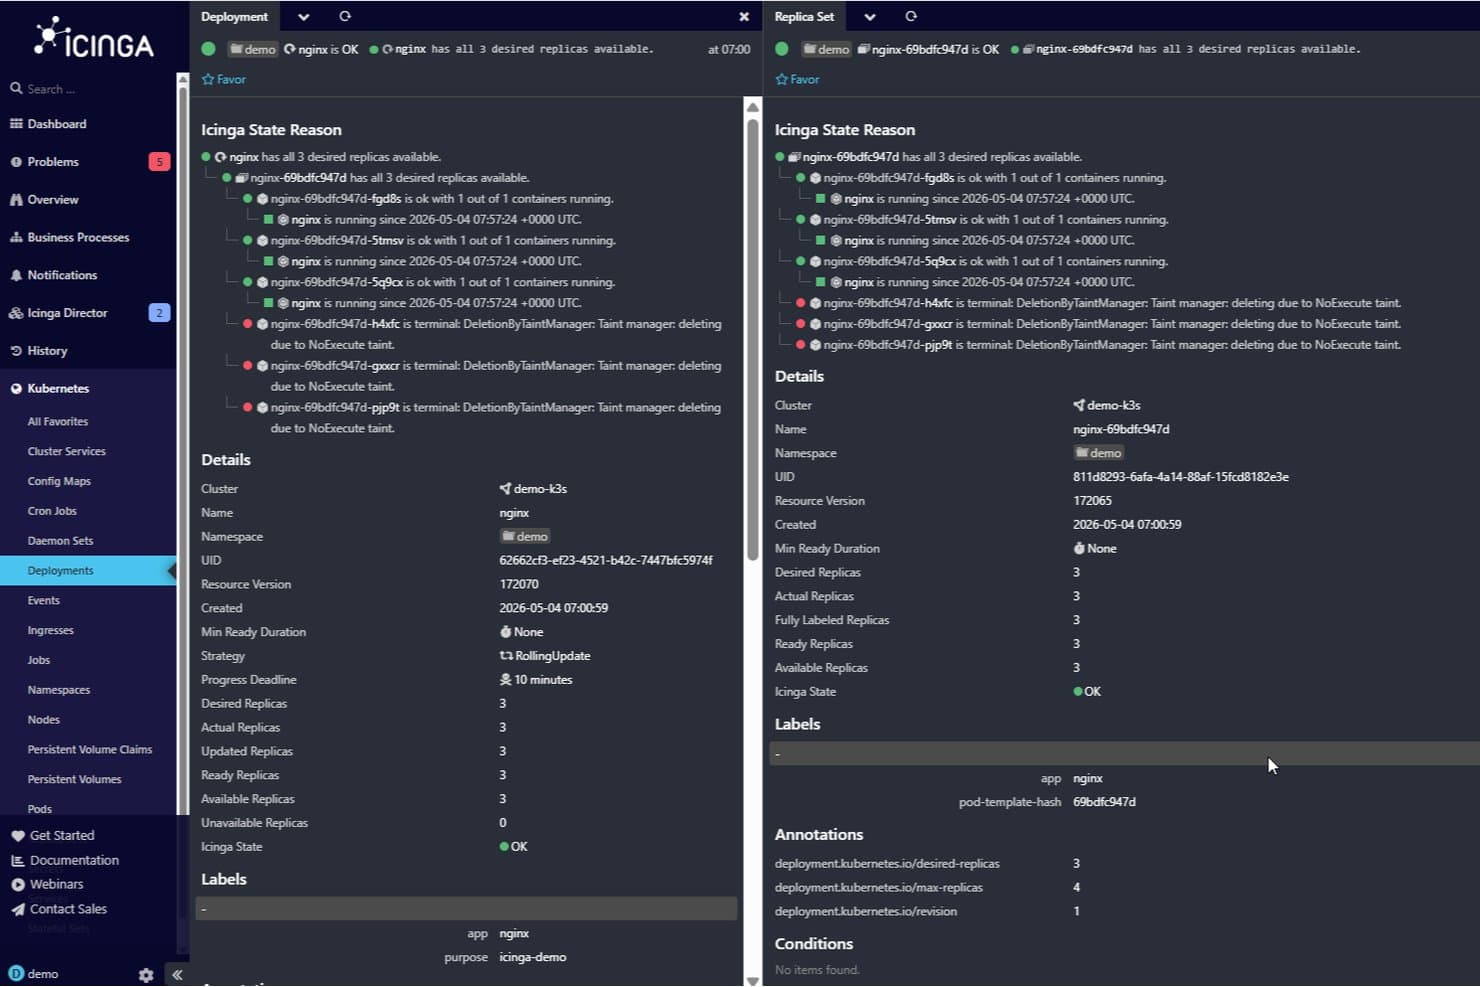
Icinga tracks all deployments on one dashboard with labels, details, and annotations. Icinga is an open-source monitoring platform built for teams managing large, distributed IT environments, offering full-stack visibility across servers, networks, applications, and cloud infrastructure from a single interface.
Who Is Icinga Best For?
Icinga is a strong fit for infrastructure and operations teams managing large, distributed environments across on-premises, hybrid, and multi-cloud systems.
Why I Picked Icinga
Icinga earns its spot on my shortlist because it's built to handle the kind of scale and sprawl that breaks simpler monitoring tools. I appreciate how its master-satellite-agent architecture lets my team distribute checks across remote locations, network segments, and cloud environments without losing centralized visibility. I also rely on its dependency mapping to suppress cascading alert noise when a parent node goes down, which keeps incident queues manageable across 80-plus locations. Nagios plugin compatibility means existing check scripts carry over rather than getting rewritten from scratch.
Icinga Key Features
- Nagios plugin compatibility: Use existing Nagios-compatible monitoring plugins directly within Icinga without rewriting your check scripts.
- Metrics collection and storage: Write collected system metrics to time-series databases including Graphite, InfluxDB, Elasticsearch, and OpenTSDB.
- Role-based access control: Assign granular access permissions to users and teams based on their roles within the monitoring environment.
- Automated configuration rules: Define apply rules that automatically generate host and service checks as your monitored environment changes.
Icinga Integrations
Icinga offers a documented Grafana integration plus integrations with Puppet, Ansible, Chef, AWS, Azure, Google Cloud Platform, Graphite, InfluxDB, Elastic, and Graylog. Its REST API supports custom integrations and configuration automation.
Pros and Cons
Pros:
- Reuses Nagios-compatible checks
- Templates reduce repetitive host configuration
- Handles large, distributed monitoring deployments
Cons:
- Notification delivery needs external scripts
- Nagios migrations require configuration rebuilding
Learn more about Icinga: Best for multi-cloud monitoring
- Free plan + 30-day trial + demo available
- From $10/month
Visit WebsiteCustomer Rating:4.7/5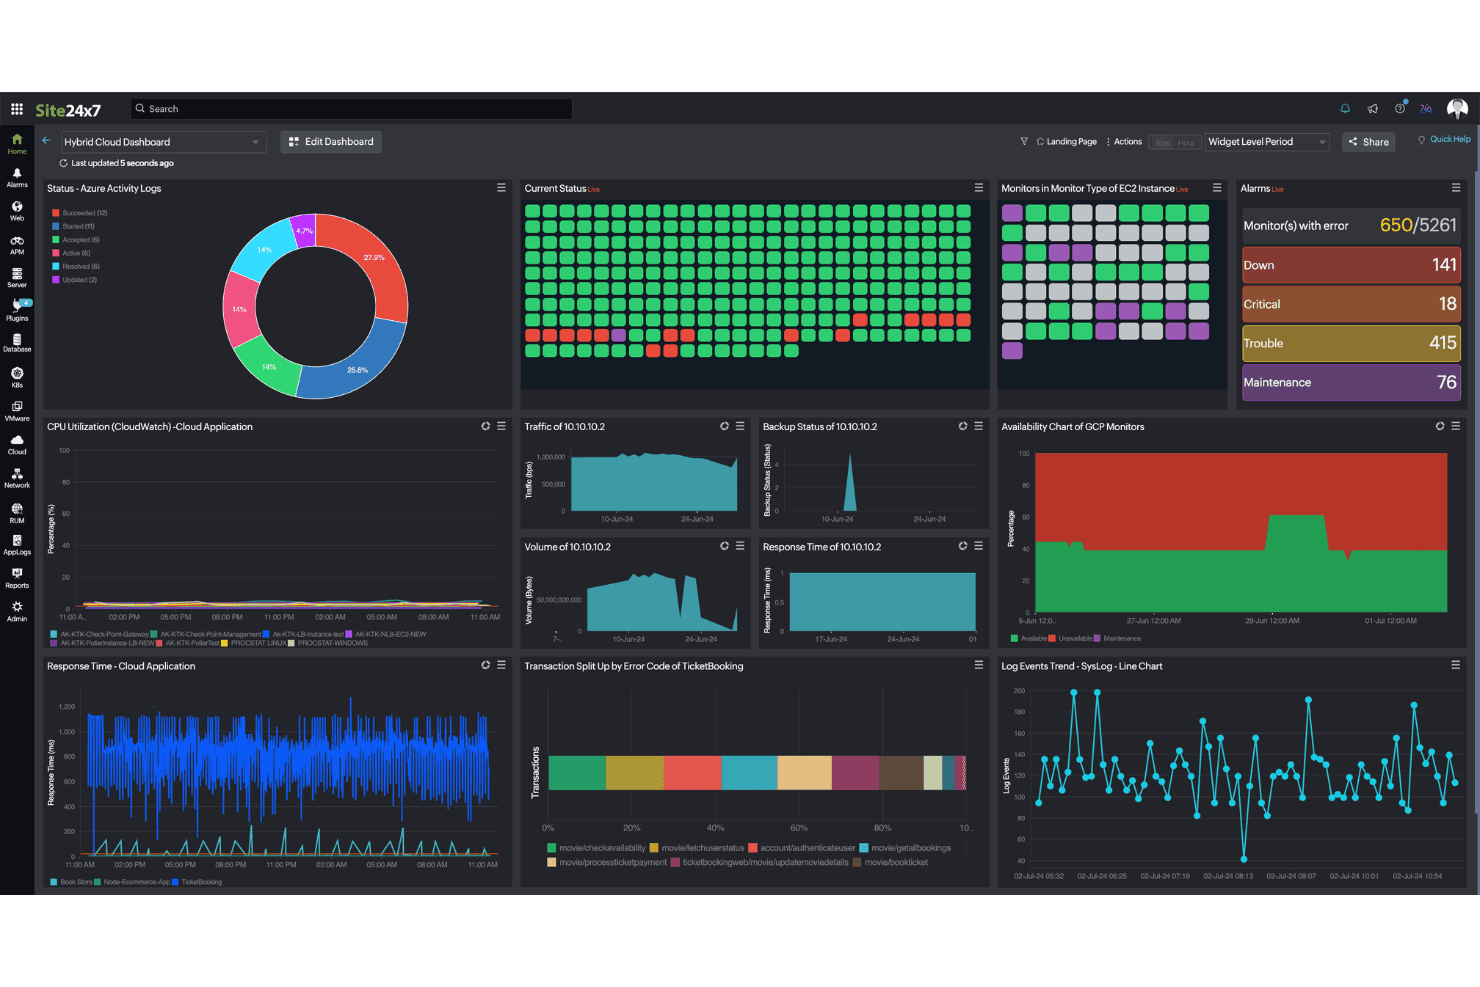
Site24x7 unifies hybrid cloud monitoring across Azure, AWS, and GCP in one dashboard. Site24x7 is an AI-powered observability platform from Zoho that helps IT teams, DevOps engineers, and system administrators monitor servers, networks, cloud infrastructure, and applications from a single console.
Who Is Site24x7 Best For?
Site24x7 is a strong fit for IT and DevOps teams running workloads across AWS, Azure, and GCP who want unified visibility without juggling multiple monitoring tools.
Why I Picked Site24x7
I picked Site24x7 as one of the best Nagios alternatives because it brings AWS, Azure, and GCP monitoring together under a single console, something Nagios simply wasn't built to do. I particularly like its On-Premise Poller, which extends visibility into internal resources behind firewalls and VPNs across branch locations without requiring a self-hosted server. Its Zia-powered anomaly detection also goes beyond static thresholds, dynamically tracking metric spikes across your multi-cloud environment so you're not constantly tuning alerts by hand.
Site24x7 Key Features
- Nagios plugin execution: Run your existing Nagios plugins through the Site24x7 Linux agent, sending results to Site24x7 without maintaining a dedicated Nagios server.
- Application Discovery and Dependency Mapping (ADDM): Visualize application relationships and topology using "Runs On," "Connects to," and infrastructure dependency data from agents, network, cloud, and virtualization sources.
- Network configuration management: Automate configuration backups, detect unauthorized changes, identify firmware vulnerabilities, and monitor compliance across network devices.
- Multi-channel notification profiles: Configure alerts via email, SMS, voice calls, and push notifications with escalation settings, persistent alerts, and consecutive-failure delays.
Site24x7 Integrations
Site24x7 offers native integrations with ServiceNow, PagerDuty, Opsgenie, Jira, Slack, and Microsoft Teams, plus webhooks for incident workflows. It provides a REST API for custom integrations and supports Zapier.
Pros and Cons
Pros:
- Poller monitors firewalled and branch systems
- Keeps Nagios plugins running through an agent
- Unified monitoring across cloud and infrastructure
Cons:
- Alert noise can require threshold tuning
- Nagios plugins require manual JSON configuration
Learn more about Site24x7: Best for web application monitoring
- Free plan + 30-day free trial + free demo available
- From $13.33/month
Visit WebsiteCustomer Rating:4.5/5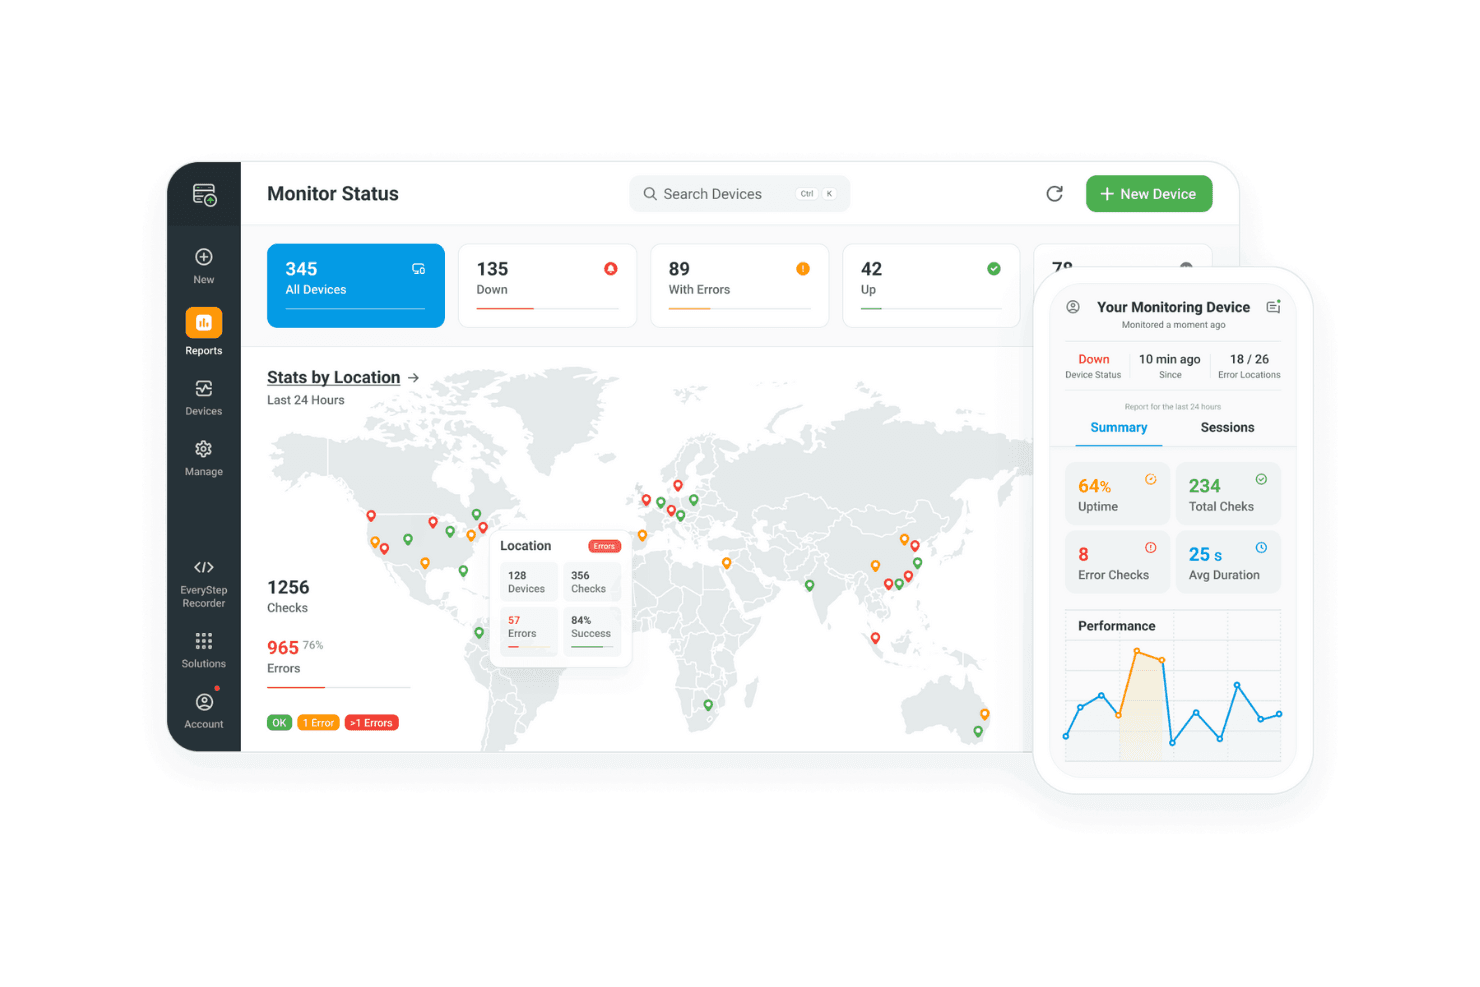
Dotcom-Monitor tracks device uptime, errors, and location stats in real time. Dotcom-Monitor is a synthetic and infrastructure monitoring platform that appeals to DevOps and SRE teams who need to track web applications, APIs, servers, and network services from a single dashboard—with real-browser checks, protocol monitoring, and private-network coverage built in.
Who Is Dotcom-Monitor Best For?
Dotcom-Monitor is a strong fit for DevOps and SRE teams that need synthetic monitoring across web apps, APIs, and infrastructure from a single dashboard.
Why I Picked Dotcom-Monitor
I picked Dotcom-Monitor as one of the best because it brings real-browser synthetic monitoring to web application checks in a way Nagios simply can't match. I love how the EveryStep Web Recorder captures multi-step user journeys, like logins or checkout flows, and replays them continuously from global locations. When a check fails, I get a screenshot, video recording, and waterfall chart alongside the alert, so I can pinpoint exactly where a transaction broke without digging through logs.
Dotcom-Monitor Key Features
- Private Agents: Deploys lightweight agents inside your private network to monitor internal systems, intranets, and firewalled services without requiring inbound firewall rules.
- Protocol and uptime checks: Monitors HTTP/HTTPS, DNS, SSL/TLS, SMTP, FTP, VoIP/SIP, TCP/UDP, ICMP, and traceroute from a single platform.
- Performance Counters (MetricsView): Collects Windows Performance Counters, Linux Collectd metrics, and SNMP v1/v2/v3 data, with configurable thresholds and baseline alerting.
- REST API and CI/CD integration: Provides a full REST API for programmatic device creation, alert configuration, and monitoring provisioning directly from deployment pipelines.
Dotcom-Monitor Integrations
Dotcom-Monitor offers native integrations with PagerDuty, Slack, Microsoft Teams, Splunk On-Call, ServiceNow, Okta, and Salesforce. It supports custom integrations through its REST API and CI/CD workflows, plus Zapier.
Pros and Cons
Pros:
- Failure alerts include response evidence and traceroutes
- Private Agents reach firewalled internal systems
- Real-browser checks expose broken user journeys
Cons:
- Crowded-monitor navigation can hinder reporting
- No automatic host or service discovery
Learn more about Dotcom-Monitor:
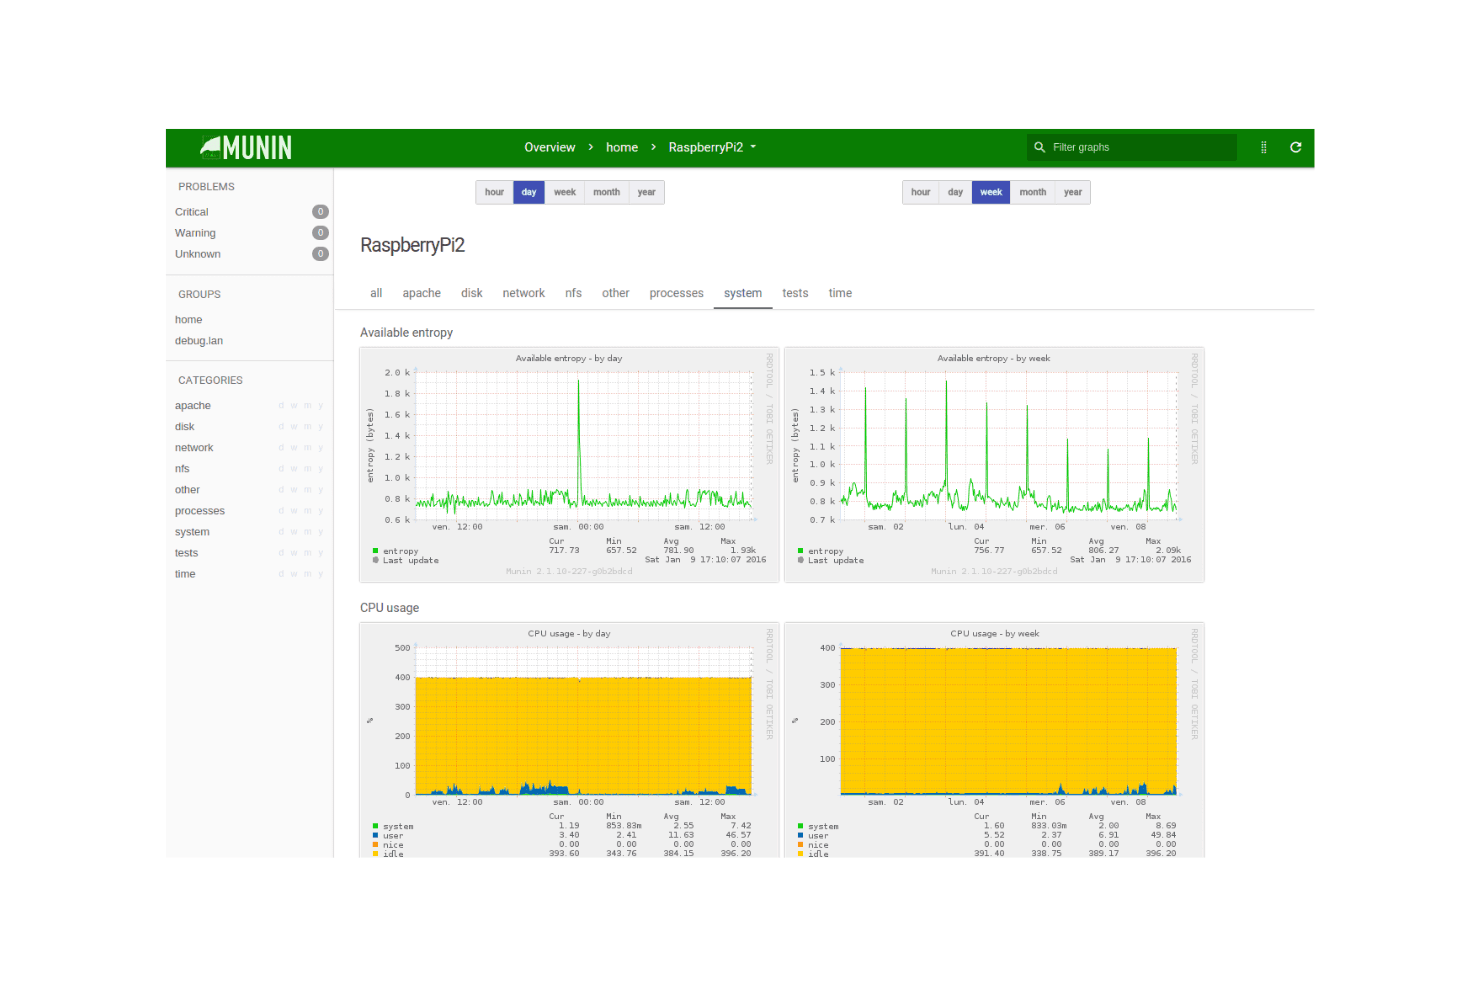
Munin visualizes CPU usage and system entropy on a Raspberry Pi. Munin is an open-source network monitoring tool that tracks resource trends over time and surfaces them as historical graphs—making it a natural fit for sysadmins and DevOps teams who need to diagnose performance problems and plan capacity across server infrastructure.
Who Is Munin Best For?
Munin is a strong fit for sysadmins and DevOps teams who want a low-cost, open-source tool to track infrastructure trends and diagnose performance issues over time.
Why I Picked Munin
I picked Munin as one of the best because its plug-and-play setup genuinely lives up to the promise:
munin-node-configure --suggestscans your node and surfaces which plugins will likely work, then prints the shell commands to install them. Once you drop plugins into the plugin directory, Munin starts graphing RRD-based trends across hour, day, week, month, and year views with no manual graph configuration required. I also appreciate that the 500-plugin library covers everything from PostgreSQL locks to disk I/O out of the box, which cuts a lot of the groundwork compared to Nagios.Munin Key Features
- Threshold-based alerting: Configure warning and critical thresholds per plugin, with notification support via email, custom scripts, Slack, and PagerDuty.
- Master/node architecture: A central Munin master polls nodes every five minutes, stores data in RRD files, and serves browser-accessible graph reports.
- SNMPv3 support: Probe network devices using SNMP versions 1, 2c, or 3, with
authPrivmode providing both authentication and encryption. - TLS encryption between master and node: Secure master-to-node communication with configurable TLS, including a strict certificate-authority-verified setup.
Munin Integrations
Munin integrates with Nagios through
send_nscaand NSCA for passive checks, but matching hosts and services must be registered in Nagios. No public API or other named integrations are documented.Pros and Cons
Pros:
- Custom plugins expose detailed service metrics
- Historical graphs clarify resource trends
- Plugin suggestions ease initial monitor setup
Cons:
- Dated graph interface limits dashboard usability
- Five-minute polling can delay outage detection
Learn more about Munin: Best for full-stack observability
- Free plan + 14-day free trial + free demo available
- From $2.80/month
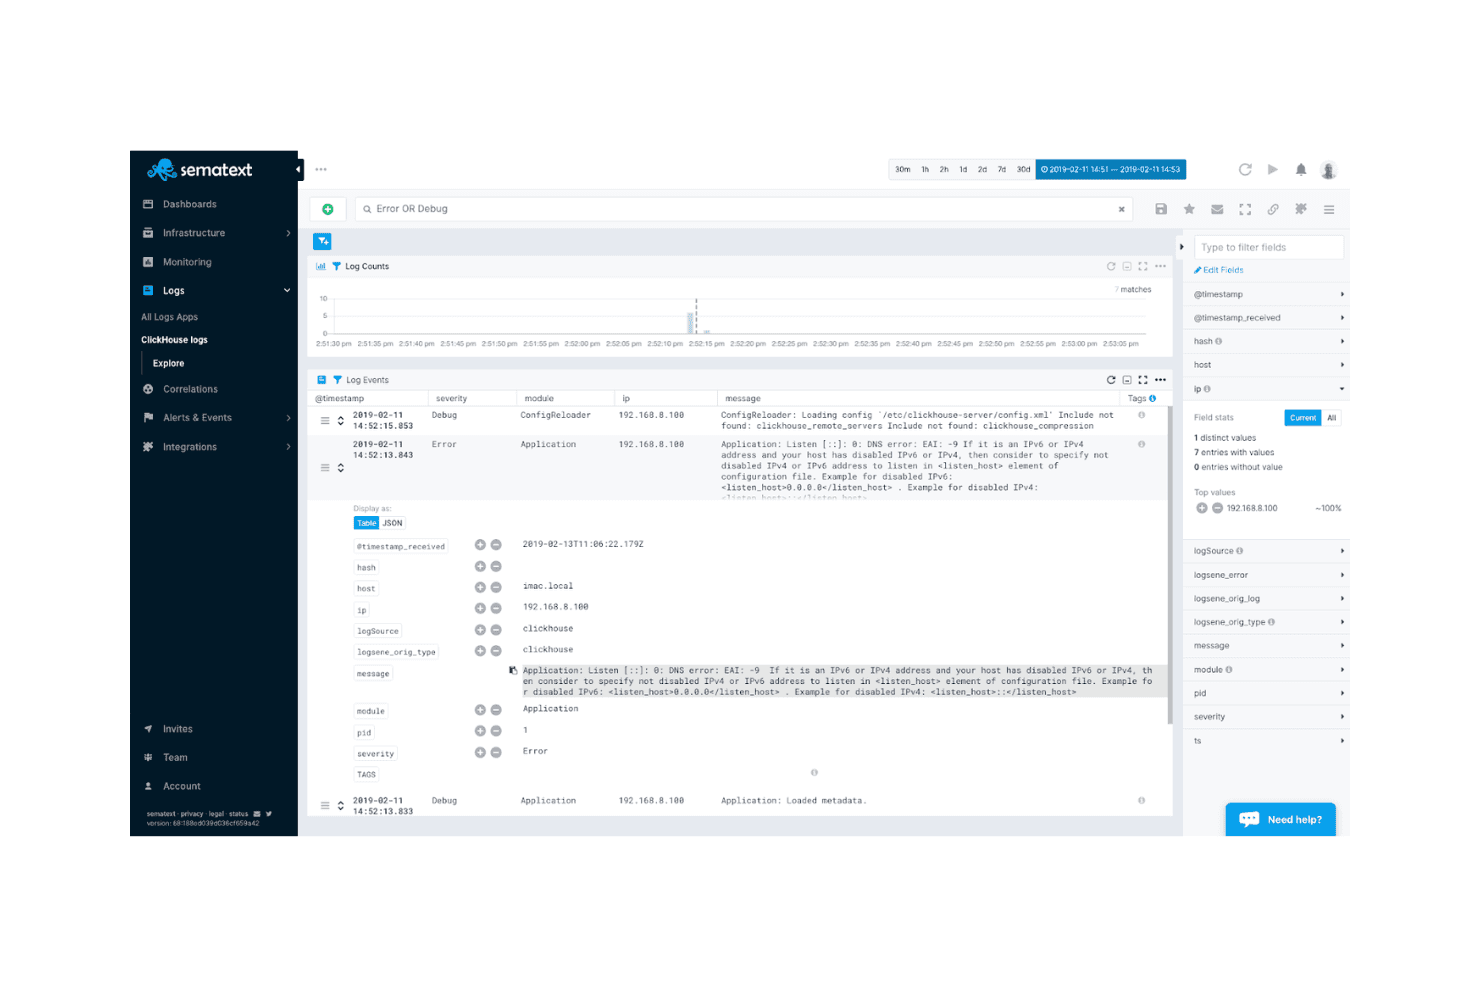
Sematext lets users search and filter logs by severity in real time. Sematext is a cloud-based infrastructure monitoring platform that appeals to DevOps and SRE teams who need to track servers, containers, Kubernetes, and cloud instances—with anomaly-based alerting and network topology mapping built in.
Who Is Sematext Best For?
Sematext is a strong fit for DevOps and SRE teams managing containerized or Kubernetes-heavy environments who need infrastructure metrics, alerting, and network topology visibility in one place.
Why I Picked Sematext
I picked Sematext as one of the best because it delivers full-stack observability across servers, containers, and Kubernetes in a way that Nagios simply can't match without heavy plugin work. I particularly like the Network Map, which uses eBPF to visualize live service, pod, and process connections across your infrastructure. Pair that with anomaly-based alerting that detects unusual spikes against a computed baseline, and you get a monitoring setup that catches issues before thresholds are even crossed.
Sematext Key Features
- Heartbeat alerts: Get notified automatically when a monitored server, container, or application stops sending data to Sematext Cloud.
- Scheduled reports: Email dashboard snapshots to recipients at daily, weekly, monthly, or quarterly intervals without granting them full platform access.
- Service autodiscovery: The Sematext Agent scans for running services and logs, letting you enable monitoring for new instances like Elasticsearch nodes directly from the Discovery UI.
- Multi-source dashboards: Combine metrics, logs, infrastructure inventory, cluster data, and events from multiple apps into a single customizable dashboard using Chart Builder.
Sematext Integrations
Sematext offers 100+ native integrations, including Nagios, Slack, PagerDuty, Opsgenie, Microsoft Teams, and Pushover. It also supports custom webhooks, Zapier, and a REST API for custom integrations.
Pros and Cons
Pros:
- Users praise detailed dashboards for troubleshooting
- Network maps expose service and process dependencies
- Anomaly alerts catch unusual infrastructure spikes
Cons:
- Users report setup friction during deployments
- Some reviewers report slow, cramped dashboards
Learn more about Sematext:
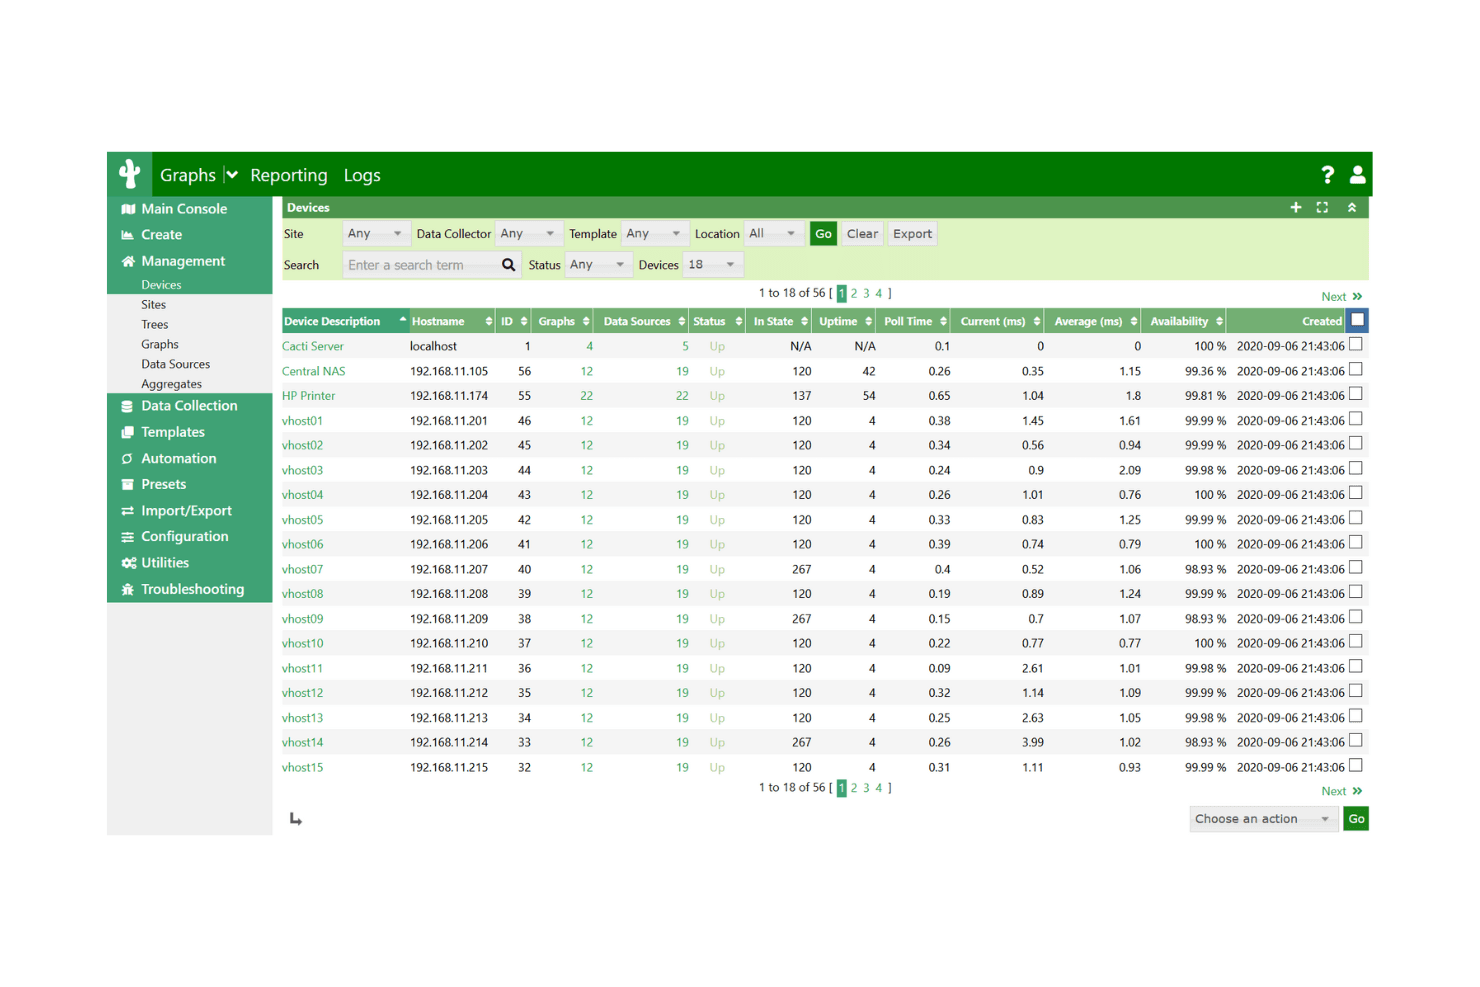
Cacti displays all monitored devices with uptime and availability metrics. Cacti is an open-source, RRDtool-based network monitoring platform built for network engineers and system administrators who need detailed graphing and performance tracking across large fleets of SNMP-capable devices like routers, switches, and firewalls.
Who Is Cacti Best For?
Cacti is a strong fit for network operations engineers and system administrators who need detailed, long-term graphing of SNMP-capable devices like routers, switches, and firewalls across large on-premises environments.
Why I Picked Cacti
I picked Cacti as one of the best Nagios alternatives because its RRDtool-based graphing engine is genuinely unmatched for long-term network performance visualization. Where Nagios focuses on alerting, Cacti lets me build detailed, customizable graphs for routers, switches, and firewalls using SNMP data, tracking interface traffic, CPU load, and BGP routes over time. I also appreciate that device templates let me group graph templates and data queries by device type, so rolling out monitoring for a new batch of Cisco switches takes minutes rather than hours.
Cacti Key Features
- Thold plugin: Configures high/low, time-based, and baseline-deviation thresholds against graph data, with Email, Syslog, and SNMP Trap escalations.
- Remote Pollers: Distributes polling load across multiple servers, placing collection sources closer to monitored devices across large networks.
- Data Source Profiles: Controls RRD file size and retention settings to manage how long historical performance data is stored.
- ReportIt plugin: Generates scheduled reports with sliding time frames and exports data to CSV, SML, and XML formats.
Cacti Integrations
Cacti doesn't have any native integrations clearly documented.
Pros and Cons
Pros:
- Remote pollers distribute collection across large networks
- Custom device templates tailor network monitoring
- Detailed SNMP graphs preserve performance history
Cons:
- Plugin updates and configuration need maintenance
- Service-down notifications can arrive late
Learn more about Cacti:
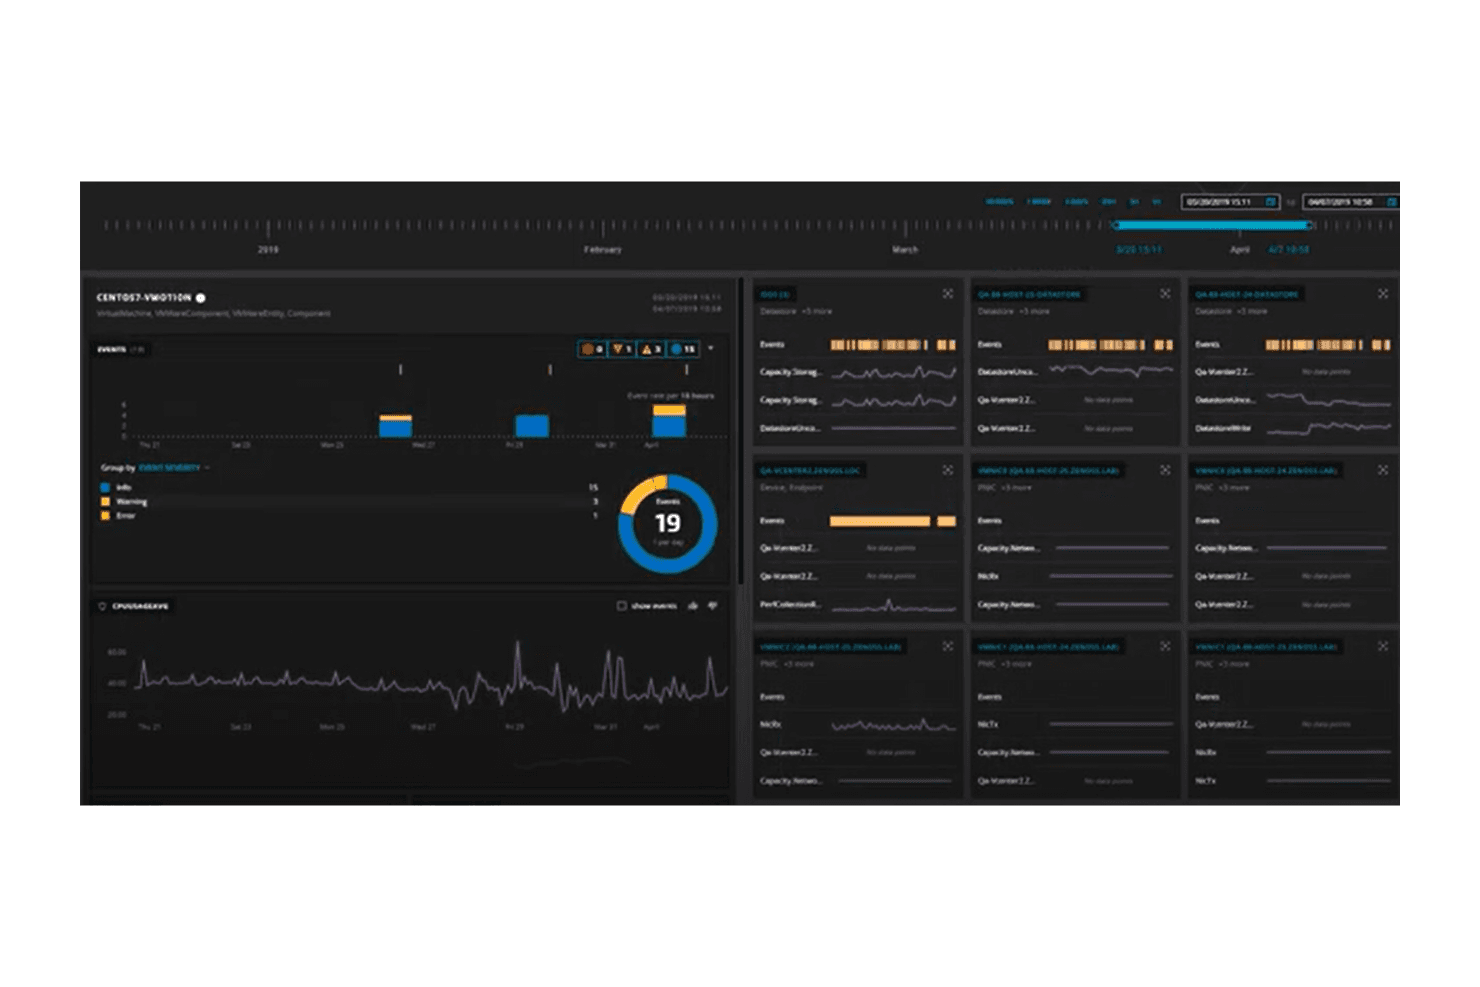
Zenoss Core monitors infrastructure events and performance metrics in real time. Virtana Service Observability (formerly Zenoss) is an AIOps-driven monitoring platform that connects infrastructure, applications, and cloud environments into a unified service view—making it a strong fit for ops teams managing complex hybrid environments who need AI-assisted root-cause analysis and dependency mapping.
Who Is Zenoss Core Best For?
Zenoss Core is a strong fit for ops teams managing complex hybrid environments who need AI-driven root-cause analysis and service-level dependency mapping in one unified view.
Why I Picked Zenoss Core
I picked Zenoss Core as one of the best Nagios alternatives because it replaces Nagios's static check-based model with a live, AI-driven service map that continuously discovers and correlates dependencies across hybrid infrastructure. I particularly like how its anomaly detection and confidence-ranked root-cause analysis narrow down where an incident actually originates, rather than flooding you with disconnected alerts. Its automatic discovery keeps service models synchronized as cloud and on-premises resources change, so you're not manually updating configs every time something shifts.
Zenoss Core Key Features
- Event correlation and filtering: Aggregates, deduplicates, and masks events across physical, virtual, and cloud resources to surface those most likely to affect service delivery.
- ZenPack extensibility: Extends monitoring with reusable device classes, monitoring templates, data sources, graphs, and event classes that can be installed or custom-built.
- Multi-channel alerting rules: Combines event, metric-threshold, and anomaly-score triggers with destinations like PagerDuty, Microsoft Teams, Slack, and ServiceNow into a single configurable rule.
- Role-based access controls: Restricts who can create and manage triggers, destinations, and alerting rules based on assigned roles within the platform.
Zenoss Core Integrations
Zenoss Core has documented integrations with ServiceNow, BMC Remedy, CA Service Desk, HP Service Manager, Cisco UCS Director, Chef, and Puppet. REST APIs and a gRPC data receiver support custom integrations.
Pros and Cons
Pros:
- Reviewers praise its readable interface
- Maps service dependencies to service impact
- Correlates storage, SAN, and server topology
Cons:
- Reviewers cite limited application-performance monitoring
- Reviewers request clearer monitoring visualizations
Learn more about Zenoss Core: Best for end-to-end monitoring
- Free plan + 30-day trial + demo available
- From €283/month (billed annually)
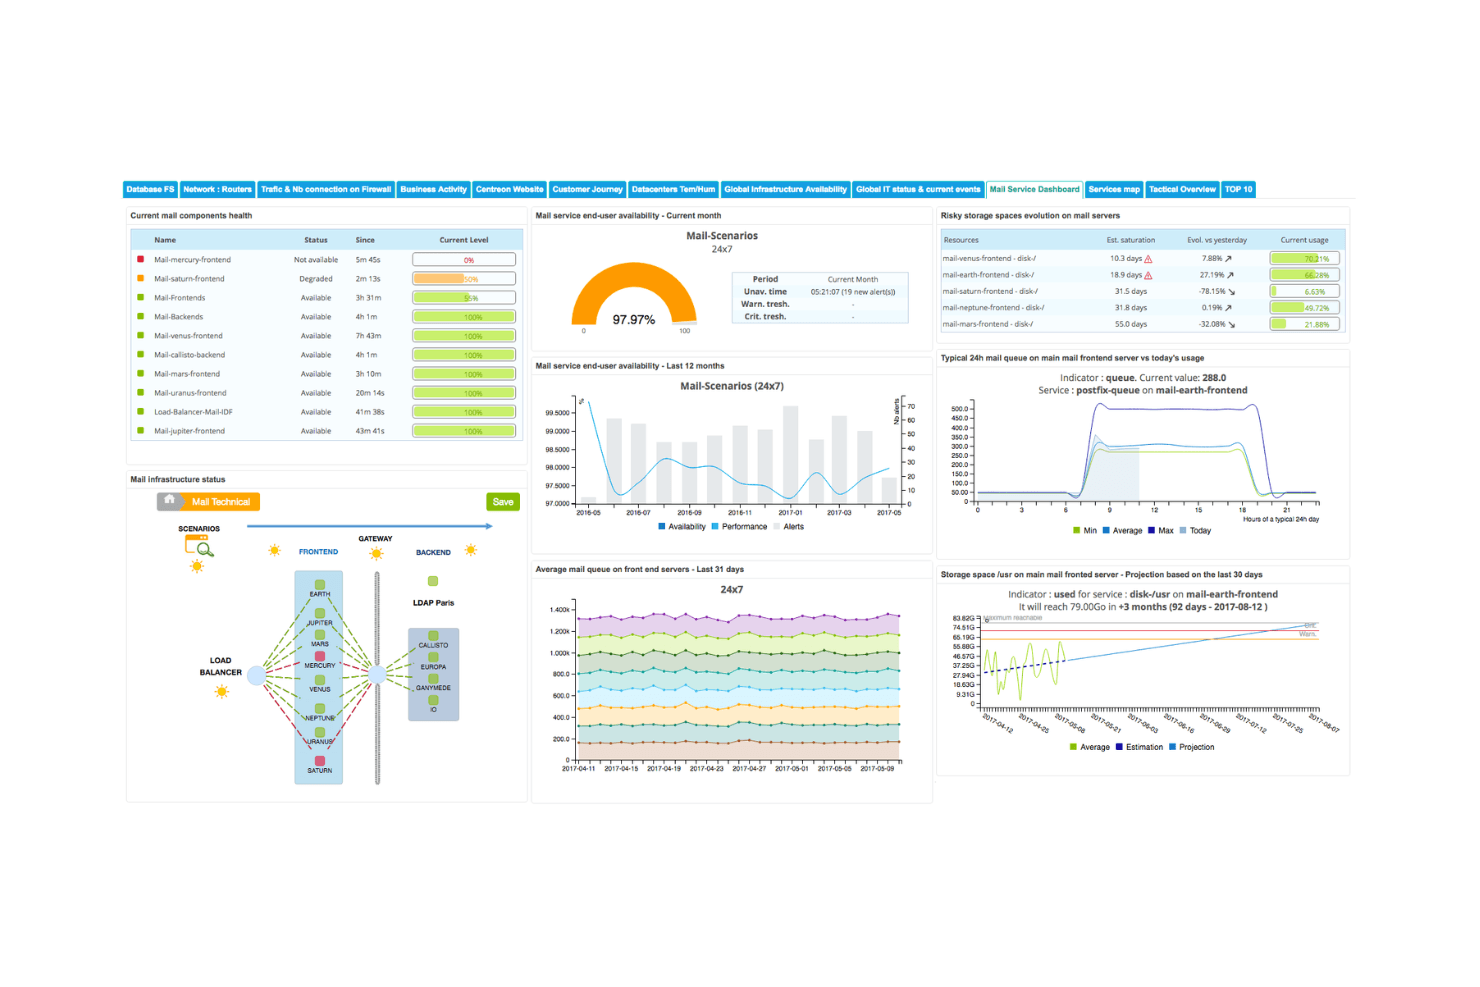
Centreon provides a unified mail service dashboard for real-time infrastructure monitoring. Centreon is a hybrid IT monitoring platform built for system administrators and DevOps teams who need unified visibility across servers, networks, cloud services, containers, and OT systems—without juggling separate tools for each layer of their infrastructure.
Who Is Centreon Best For?
Centreon is a strong fit for system administrators and DevOps teams managing heterogeneous environments that span on-premises infrastructure, cloud services, and legacy systems side by side.
Why I Picked Centreon
Centreon earns its spot on my shortlist because it's one of the few platforms that genuinely covers end-to-end monitoring across servers, networks, cloud services, containers, and OT systems without requiring separate tools for each layer. I particularly like the Business Activity Monitoring feature, which links technical service status directly to business activities so my team can see not just that something is down, but what operations it's affecting. The 700+ prebuilt monitoring connectors, with expert-tuned defaults, mean I can bring Kubernetes clusters and legacy AS/400 systems into the same monitoring view.
Centreon Key Features
- Nagios CFG migration utility: A free, open-source tool reads your existing Nagios CFG files and converts them into Centreon CLAPI commands for direct import.
- Multi-channel escalation notifications: Sends alerts via email, SMS, Slack, Microsoft Teams, and Telegram, with configurable resend intervals and escalation rules.
- Distributed poller architecture: Deploys pollers and optional remote servers across sites or network zones to collect and buffer monitoring data independently of the central server.
- Role-based access control: Assigns user groups and granular rights across pollers, resources, UI menus, and actions, with LDAP, SAMLv2, and OpenID Connect support.
Centreon Integrations
Centreon offers 736 marketplace monitoring connectors, including Amazon EC2, Azure Virtual Machine, Kubernetes API, VMware vCenter, Cisco Standard SNMP, Microsoft SQL Server, and PostgreSQL. It integrates with ServiceNow, Jira, PagerDuty, Grafana, and Kafka, with REST API v1 and v2, CLAPI, and MAP API support.
Pros and Cons
Pros:
- Unified legacy and modern monitoring coverage
- GUI workflows replace hand-edited configuration
- Nagios CFG migration utility eases transition
Cons:
- Initial setup and thresholds take time
- Connector plugins need separate upkeep
Learn more about Centreon:
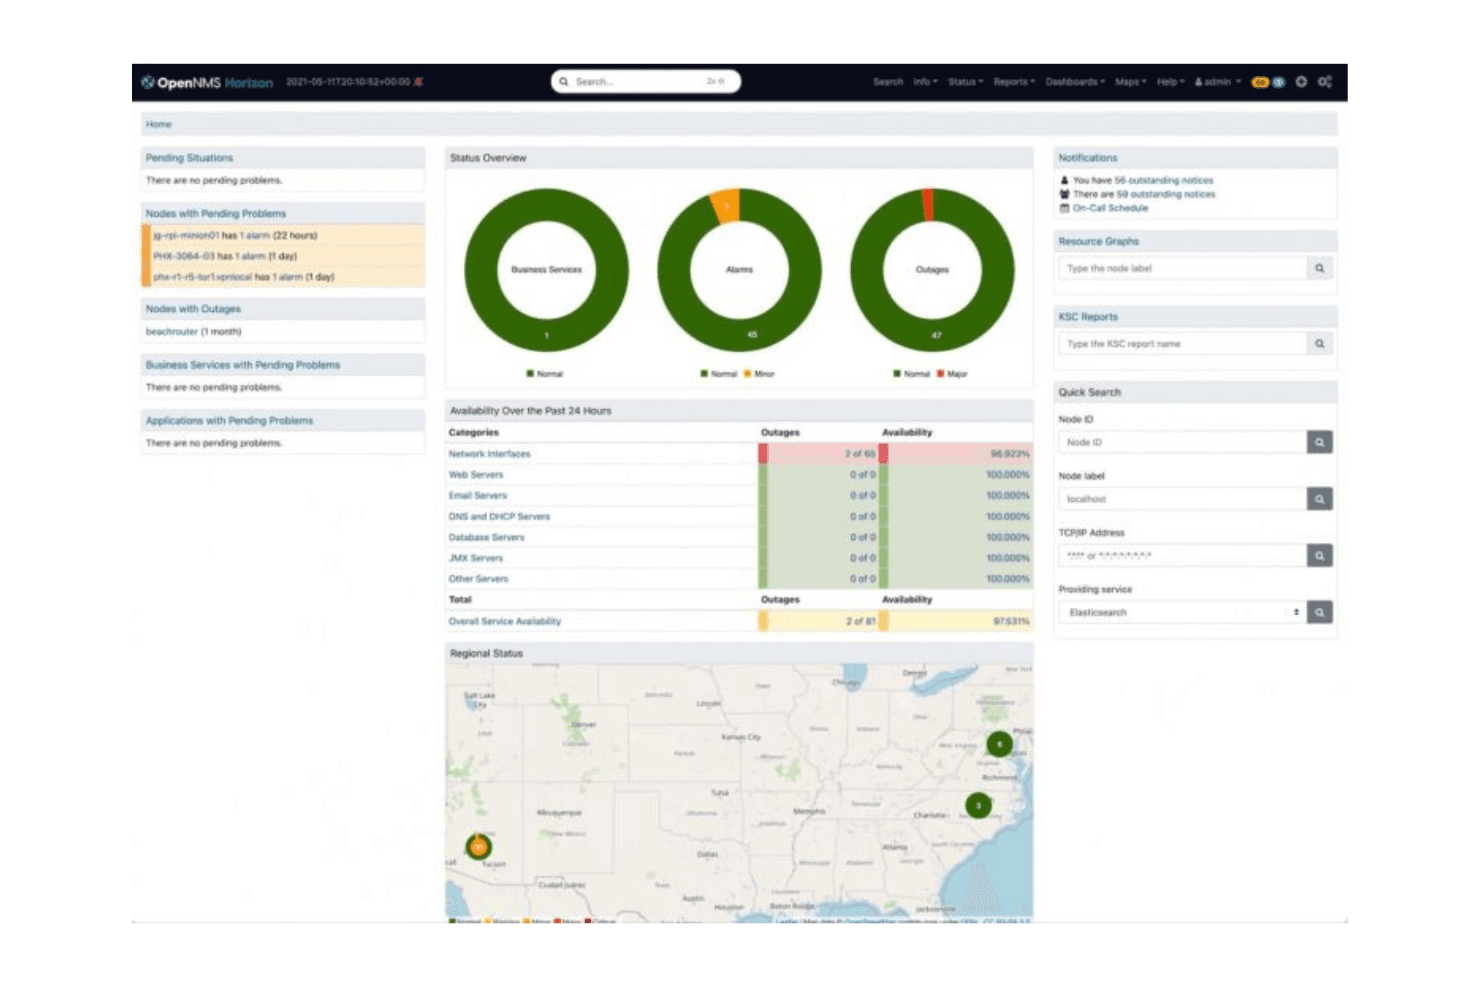
OpenNMS provides a central dashboard for monitoring network status and outages. OpenNMS is an open-source network monitoring platform built for technically skilled teams who need deep protocol support, distributed monitoring across remote or firewalled sites, and scalable fault and performance visibility across large, complex infrastructure.
Who Is OpenNMS Best For?
OpenNMS is a strong fit for network operations teams managing large, distributed infrastructure who need deep protocol support and flexible remote monitoring across firewalled or segmented sites.
Why I Picked OpenNMS
I picked OpenNMS because its Minion architecture genuinely solves the distributed monitoring problem that Nagios handles poorly. Minions sit inside firewalled or NAT-separated network segments and relay data back to the core, so my team can monitor remote sites without punching holes in the firewall or running a separate monitoring instance at each location. I also appreciate that OpenNMS discovers Layer 2 and Layer 3 topology automatically, giving my team a live map of how devices relate to each other across those distributed segments.
OpenNMS Key Features
- ALEC alarm correlation: Groups related alarms into higher-level situations using temporal clustering, machine learning, and live topology data.
- NetFlow and streaming telemetry ingestion: Collects and processes NetFlow v5/v9, IPFIX, sFlow, and vendor-specific telemetry streams, including Cisco NX-OS and OpenConfig.
- Device configuration backup: Schedules or triggers on-demand backups of device configurations, retains version history, and supports side-by-side comparison over time.
- REST API and plugin development API: Exposes inventory, measurements, events, alarms, and flows through a REST API, with a stable plugin API for extending or consuming platform functionality.
OpenNMS Integrations
OpenNMS has documented native integrations with PagerDuty, Grafana, Jira, Remedy, TSRM, Slack, and Mattermost, plus Kafka and Prometheus RemoteWrite connectivity. Its REST and plugin APIs support custom integrations.
Pros and Cons
Pros:
- Reviewers value graphs and network reports
- Broad SNMP coverage spans mixed infrastructure
- Minions reach firewalled remote networks
Cons:
- Dated dashboards require extra navigation
- XML edits complicate Nagios replacement
Learn more about OpenNMS:
Outras alternativas ao Nagios
Eis algumas alternativas adicionais ao Nagios que não entraram na minha lista, mas que vale a pena conhecer:
- 11MonitorixBest for lightweight monitoring
- 12op5 MonitorBest for enterprise scalability
- 13NaemonBest for modular architecturePricing upon request
- 14ArgusBest for system and network monitoring
- 15DatadogBest for cloud monitoring
- 16SolarWinds Network Performance MonitorBest for network performance insights
- 17ManageEngine OpManagerBest for enterprise IT management
- 18ZabbixBest for open-source flexibility
- 19NetdataBest for real-time system metrics
- 20PrometheusBest for time-series data handling
How I Evaluate Nagios Alternatives
I split my evaluation into two layers: the baseline every tool must clear—real-time alerting, multi-environment coverage, auto-discovery—and the differentiators that separate the best from the rest.
Core Functionality (Table Stakes For This List)
When I'm selecting tools for my list, I rank each one on a scale from 0 (does not offer the functionality) to 5 (excels in this area) for each core functionality listed below. Then, I calculate the tool's total score into a percentage. Each tool needs to achieve a minimum total score of 75% to be considered for inclusion.
- Infrastructure Monitoring: I check whether a tool tracks servers, network devices, and services with real-time health checks and performance metrics—like CPU, memory, disk, and interface utilization across a mixed fleet of Linux and Windows hosts.
- Alerting & Notifications: Each tool should support multi-channel alerts (email, Slack, PagerDuty, SMS) with configurable thresholds and escalation policies, so the right on-call engineer gets paged when a disk fills up at 2 a.m.
- Dashboards & Visualization: I evaluate whether dashboards are customizable enough to build role-specific views—a NOC wall display showing network status vs. a DevOps team's container performance panel, for example.
- Auto-Discovery & Agent Support: Tools that auto-discover hosts and services via SNMP, WMI, or cloud provider APIs save hours of manual configuration, and I look for flexible agent-based and agentless options to cover firewalled segments and cloud VPCs alike.
- Integrations & Extensibility: I look at prebuilt integrations with ITSM platforms like ServiceNow or Jira Service Management, plus API access and plugin support for writing custom checks or feeding data into tools like Grafana.
- Multi-Environment Coverage: Whether you're running bare-metal servers, multi-cloud workloads across AWS and Azure, or Kubernetes clusters, I evaluate how well each tool monitors across on-prem, cloud, and containerized environments.
Once I have a list of tools that meet this criteria, I consider what sets each platform apart.
Differentiating Factors (What Sets Vendors Apart)
Here's how I compare and contrast different vendors:
Standout Features
AIOps capabilities matter a lot here. Tools that use machine learning to baseline normal behavior and flag true anomalies cut through alert noise in ways static thresholds never will. I also evaluate dependency and topology mapping—when a core switch goes down, seeing the blast radius across dependent services speeds up triage dramatically. Automation and self-healing round out the picture. I look for tools that can trigger runbook actions automatically, like restarting a failed service or clearing a temp directory before an alert even reaches the on-call team.
Beyond Features
Migration support is a big deal when you're moving off Nagios. I check whether a tool can import existing check configurations or reuse custom plugins to avoid rebuilding from scratch. Pricing transparency matters just as much—Nagios users are accustomed to open-source economics, so I evaluate whether vendors offer a free tier or predictable per-host pricing that won't spike as your environment grows. Community and ecosystem health also carry weight. An active plugin marketplace and frequent release cadence signal long-term viability.
Por que procurar uma alternativa ao Nagios?
Embora o Nagios seja uma boa escolha de software de monitorização, existem várias razões pelas quais alguns utilizadores procuram soluções alternativas. Pode estar à procura de uma alternativa ao Nagios porque…
- Precisa de interfaces de utilizador mais intuitivas
- A sua equipa necessita de uma melhor escalabilidade
- Procura uma configuração mais simples
- Pretende capacidades avançadas de análise
- A sua empresa precisa de sistemas de alertas mais rápidos
Se alguma destas situações lhe parece familiar, veio ao lugar certo. A minha lista contém várias opções de desenvolvimento de software mais adequadas para equipas que enfrentam estes desafios com o Nagios e procuram soluções alternativas. Para equipas que consideram soluções de monitorização mais abrangentes, explorar alternativas ao New Relic pode proporcionar opções adicionais para uma monitorização abrangente do desempenho das aplicações.
Principais funcionalidades do Nagios
Eis algumas das principais funcionalidades do Nagios, para ajudar a contrastar e comparar o que as soluções alternativas oferecem:
- Capacidades de monitorização: Monitoriza o desempenho e a disponibilidade de servidores, aplicações e dispositivos de rede.
- Sistema de alertas: Envia notificações por e-mail ou SMS quando surgem problemas, permitindo uma resposta rápida.
- Interface Web: Disponibiliza um painel intuitivo para monitorização e elaboração de relatórios em tempo real.
- Plug-ins personalizáveis: Suporta vários plug-ins para funcionalidades alargadas adaptadas a necessidades específicas.
- Escalabilidade: Pode ser dimensionado para monitorizar ambientes de grandes dimensões com inúmeros dispositivos.
- Suporte da comunidade: Conta com o apoio de uma comunidade ativa para resolução de problemas e melhorias.
- Remediação de problemas: Inclui funcionalidades como confirmações de alertas e processadores de eventos para a resolução automática de problemas.
- Planeamento proativo: Ferramentas para análise de tendências, planeamento de capacidade e gestão de períodos de inatividade programados.
- Relatórios: Gera relatórios de disponibilidade e históricos para acompanhar o desempenho e a conformidade com os SLA.
- Capacidades multi-inquilino: Permite que vários utilizadores acedam a vistas personalizadas da infraestrutura.