

Prometheuksen arvostelu: hyvät ja huonot puolet, ominaisuudet & hinnoittelu
Prometheus erottuu edukseen avoimen lähdekoodin joustavuutensa, reaaliaikaisen seurannan ja monimutkaisten verkonvalvontaympäristöjen skaalautuvuutensa ansiosta.

We review tools independently, and commissions help fund our testing. See our transparency policy, our methodology, or suggest a tool.
Prometheus is an open-source network monitoring software built around a pull-based metrics collection model and a time-series query language for analyzing system and application performance data. It's a strong fit for teams monitoring containerized infrastructure—especially Kubernetes environments—where dynamic service discovery and fine-grained metric collection matter most. I'd consider it over a platform like Datadog if your team wants full control over your monitoring stack without per-host licensing costs, though you should expect to invest meaningful time in configuration and ongoing maintenance that a managed SaaS tool would otherwise handle.
Prometheus Evaluation Summary
4.4/5
- No licensing cost
- Free to use
Why Trust Our Software Recommendations
6,700+
Reviews
20
Industry experts
16+
Evaluation factors
14
Years
Our team has been testing and reviewing software since 2012. As tech leaders ourselves, we know how difficult—and important—it is to choose the right software.
For this guide, we evaluated tools using hands-on testing and independent research, scoring tools using our selection criteria.
Our reviews reflect our human editorial judgment, not a sales pitch.
Expert reviewers:
- Paulo Gardini MiguelTech Director
 Tim FisherVP of AI
 Gabriel RosasTech Lead & Software Architect
 Christhian GruhnTech Lead & Platform Architect

Prometheus Overview
Prometheus excels in cloud-native environments, offering a robust open-source solution perfect for your team’s complex monitoring needs.
Pros
- Prometheus's real-time alerting helps your team react swiftly to system changes.
- It offers extensive customization for monitoring metrics that matter to your work.
- The open-source nature allows you to tailor it exactly to your IT environment.
Cons
- Prometheus's steep learning curve might challenge your newer team members.
- Its lack of native long-term storage can complicate historical data analysis.
- The complex setup may require more initial time investment from your team.
Is Prometheus Right For Your Needs?
Who Would be a Good Fit for Prometheus?
Prometheus is ideal for DevOps teams in tech companies that need real-time monitoring and alerting. If your work involves managing cloud-native environments, Prometheus’s ability to customize metrics will help you address specific needs. IT departments in large enterprises can benefit from its scalability, making it a strong choice for managing complex infrastructures. Its open-source nature allows you to adapt it to your existing systems, giving you the flexibility to innovate without being tied to commercial software constraints.
- Cloud ServicesPrometheus is perfect for monitoring dynamic cloud environments due to its real-time data processing and alerting capabilities.
- Large EnterprisesIts scalability ensures your team can monitor extensive networks and infrastructure without performance issues.
- Tech StartupsYou can leverage its open-source nature for cost-effective, customizable solutions in fast-paced development environments.
- IT DepartmentsPrometheus provides your team with the tools needed for detailed system monitoring and prompt issue detection.
- DevOps TeamsIts customizable metrics and alerting systems are tailored for your continuous integration and deployment processes.
- Data CentersPrometheus excels in environments requiring precise monitoring and quick response to hardware or network changes.
Who Would be a Bad Fit for Prometheus?
Small businesses with limited IT resources might struggle with Prometheus due to its complex setup and steep learning curve. Non-tech industries that don’t require in-depth monitoring might find it too robust for their needs. If your team needs integrated long-term data storage, Prometheus’s lack of native storage options could be a significant drawback, requiring additional tools or workarounds.
- Small BusinessesPrometheus’s complexity and setup demands may overwhelm your limited IT resources.
- Non-Tech IndustriesYou might find its advanced monitoring capabilities excessive for simple network needs.
- Retail ChainsPrometheus lacks integrated long-term storage, which could hinder your historical sales data analysis.
- Healthcare ProvidersYou may need simpler solutions with built-in compliance features for sensitive data monitoring.
- Educational InstitutionsThe high customization might not align with your need for straightforward, user-friendly tools.
- FreelancersIf you’re a solo operator, Prometheus’s extensive features might be more than you need for basic monitoring.
Our Review Methodology
How We Test & Score Tools
We’ve spent years building, refining, and improving our software testing and scoring system. The rubric is designed to capture the nuances of software selection and what makes a tool effective, focusing on critical aspects of the decision-making process.
Below, you can see exactly how our testing and scoring works across seven criteria. It allows us to provide an unbiased evaluation of the software based on core functionality, standout features, ease of use, onboarding, customer support, integrations, customer reviews, and value for money.
Core Functionality (25% of final scoring)
The starting point of our evaluation is always the core functionality of the tool. Does it have the basic features and functions that a user would expect to see? Are any of those core features locked to higher-tiered pricing plans? At its core, we expect a tool to stand up against the baseline capabilities of its competitors.
Standout Features (25% of final scoring)
Next, we evaluate uncommon standout features that go above and beyond the core functionality typically found in tools of its kind. A high score reflects specialized or unique features that make the product faster, more efficient, or offer additional value to the user.
We also evaluate how easy it is to integrate with other tools typically found in the tech stack to expand the functionality and utility of the software. Tools offering plentiful native integrations, 3rd party connections, and API access to build custom integrations score best.
Ease of Use (10% of final scoring)
We consider how quick and easy it is to execute the tasks defined in the core functionality using the tool. High scoring software is well designed, intuitive to use, offers mobile apps, provides templates, and makes relatively complex tasks seem simple.
Onboarding (10% of final scoring)
We know how important rapid team adoption is for a new platform, so we evaluate how easy it is to learn and use a tool with minimal training. We evaluate how quickly a team member can get set up and start using the tool with no experience. High scoring solutions indicate little or no support is required.
Customer Support (10% of final scoring)
We review how quick and easy it is to get unstuck and find help by phone, live chat, or knowledge base. Tools and companies that provide real-time support score best, while chatbots score worst.
Customer Reviews (10% of final scoring)
Beyond our own testing and evaluation, we consider the net promoter score from current and past customers. We review their likelihood, given the option, to choose the tool again for the core functionality. A high scoring software reflects a high net promoter score from current or past customers.
Value for Money (10% of final scoring)
Lastly, in consideration of all the other criteria, we review the average price of entry level plans against the core features and consider the value of the other evaluation criteria. Software that delivers more, for less, will score higher.
Core Features
Real-Time Monitoring
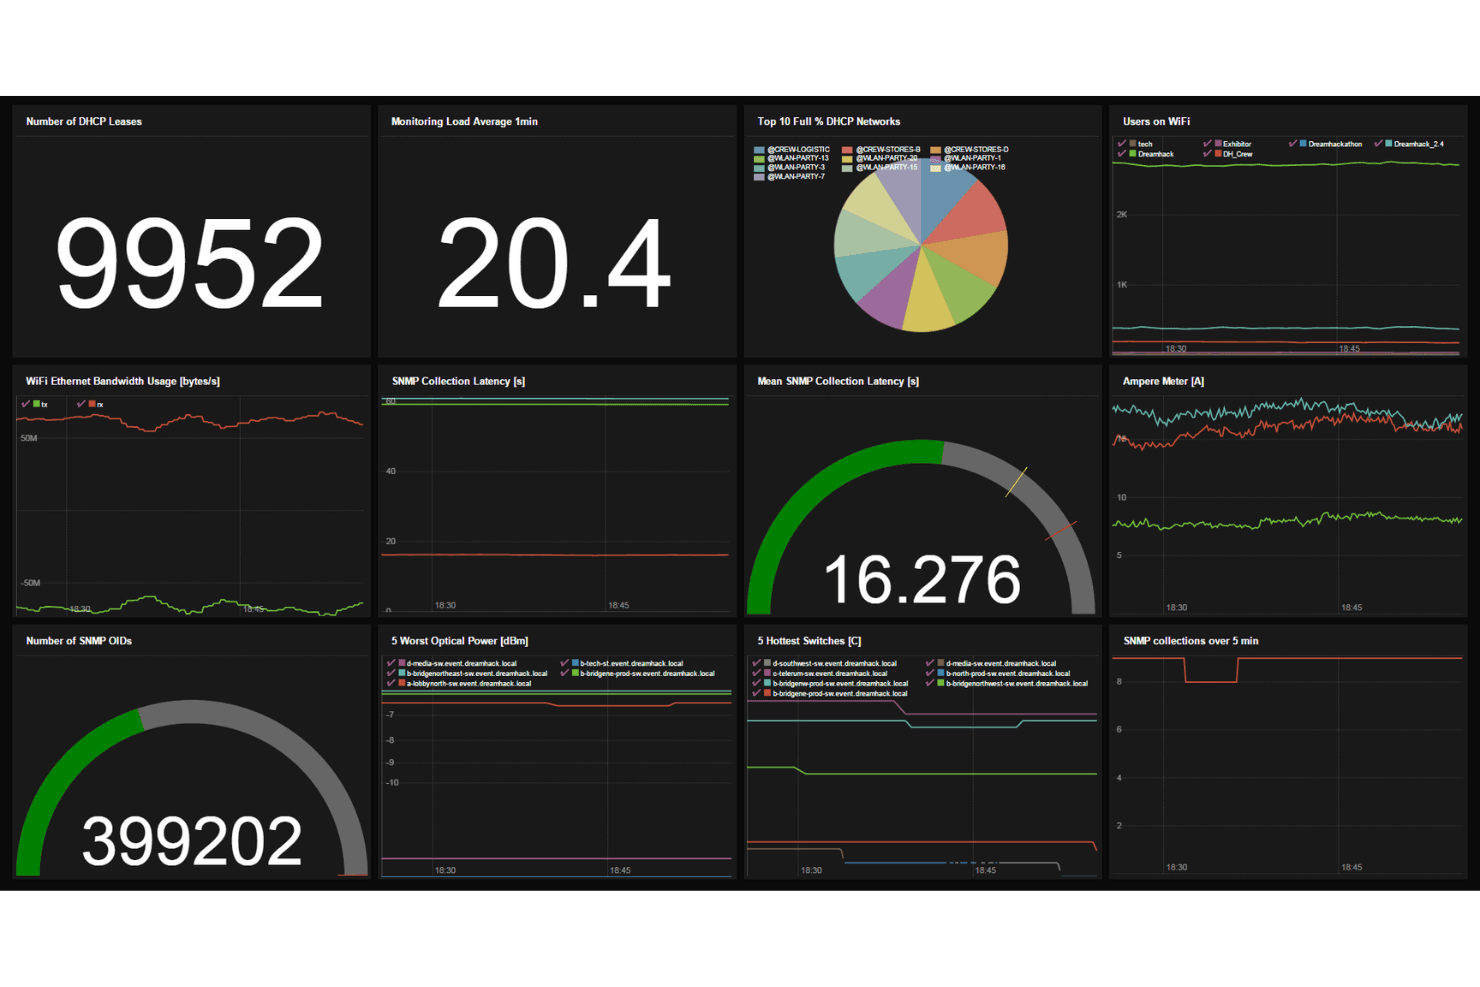
Prometheus continuously collects data from your systems, providing instant insights into performance. This helps your team react quickly to any anomalies.
Alerting System
You can set up alerts based on specific conditions, ensuring you’re notified immediately of any critical issues. This keeps your network running smoothly.
Data Visualization
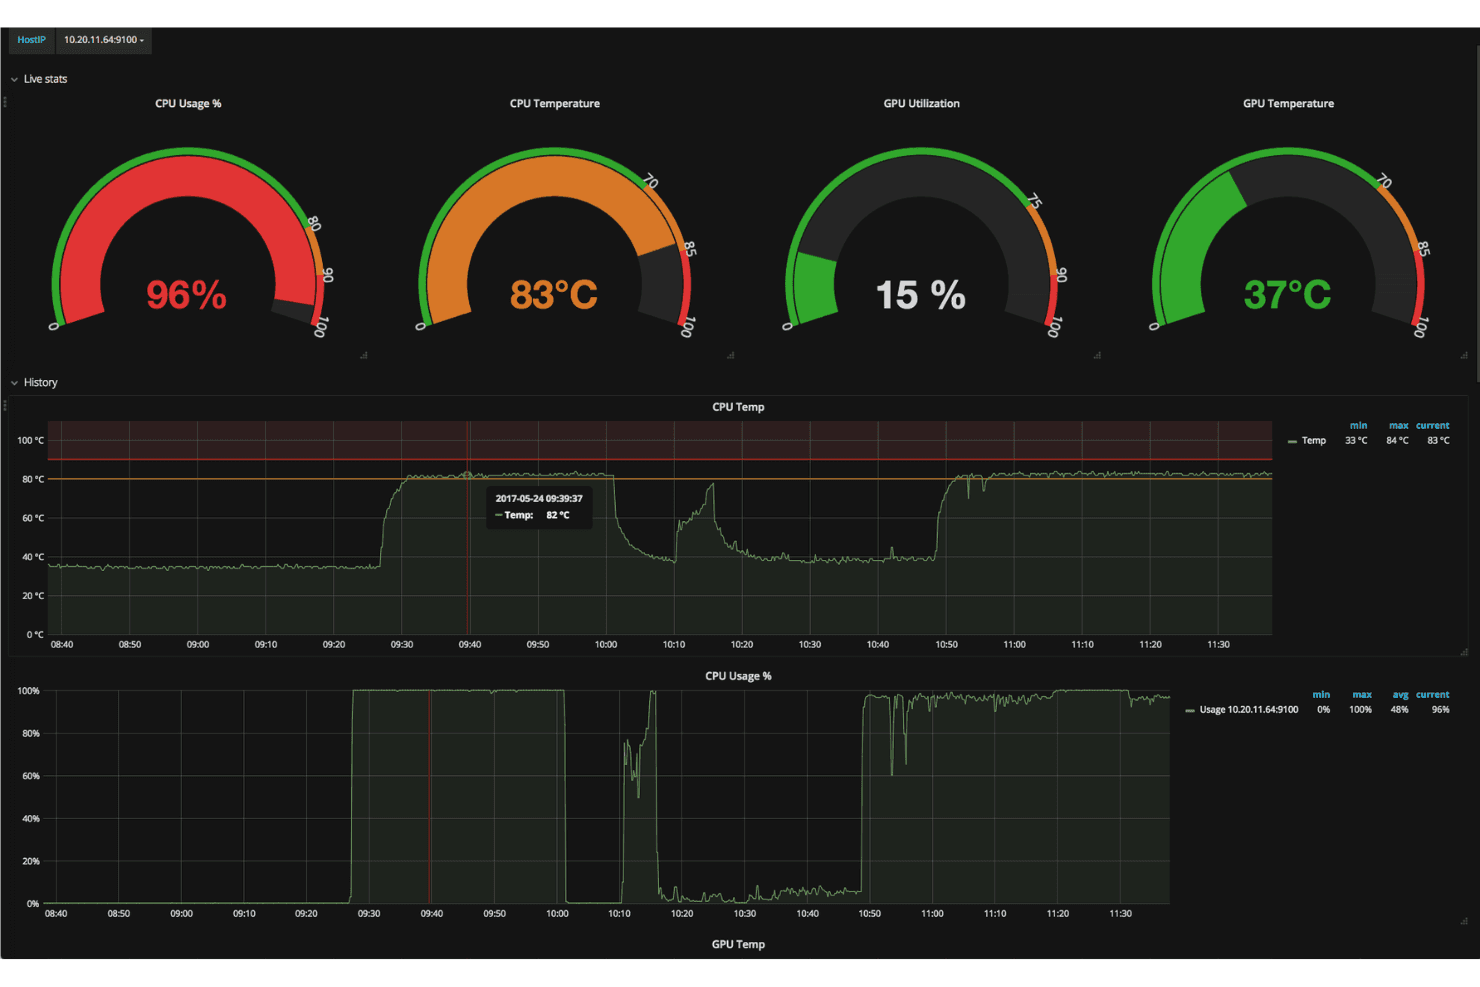
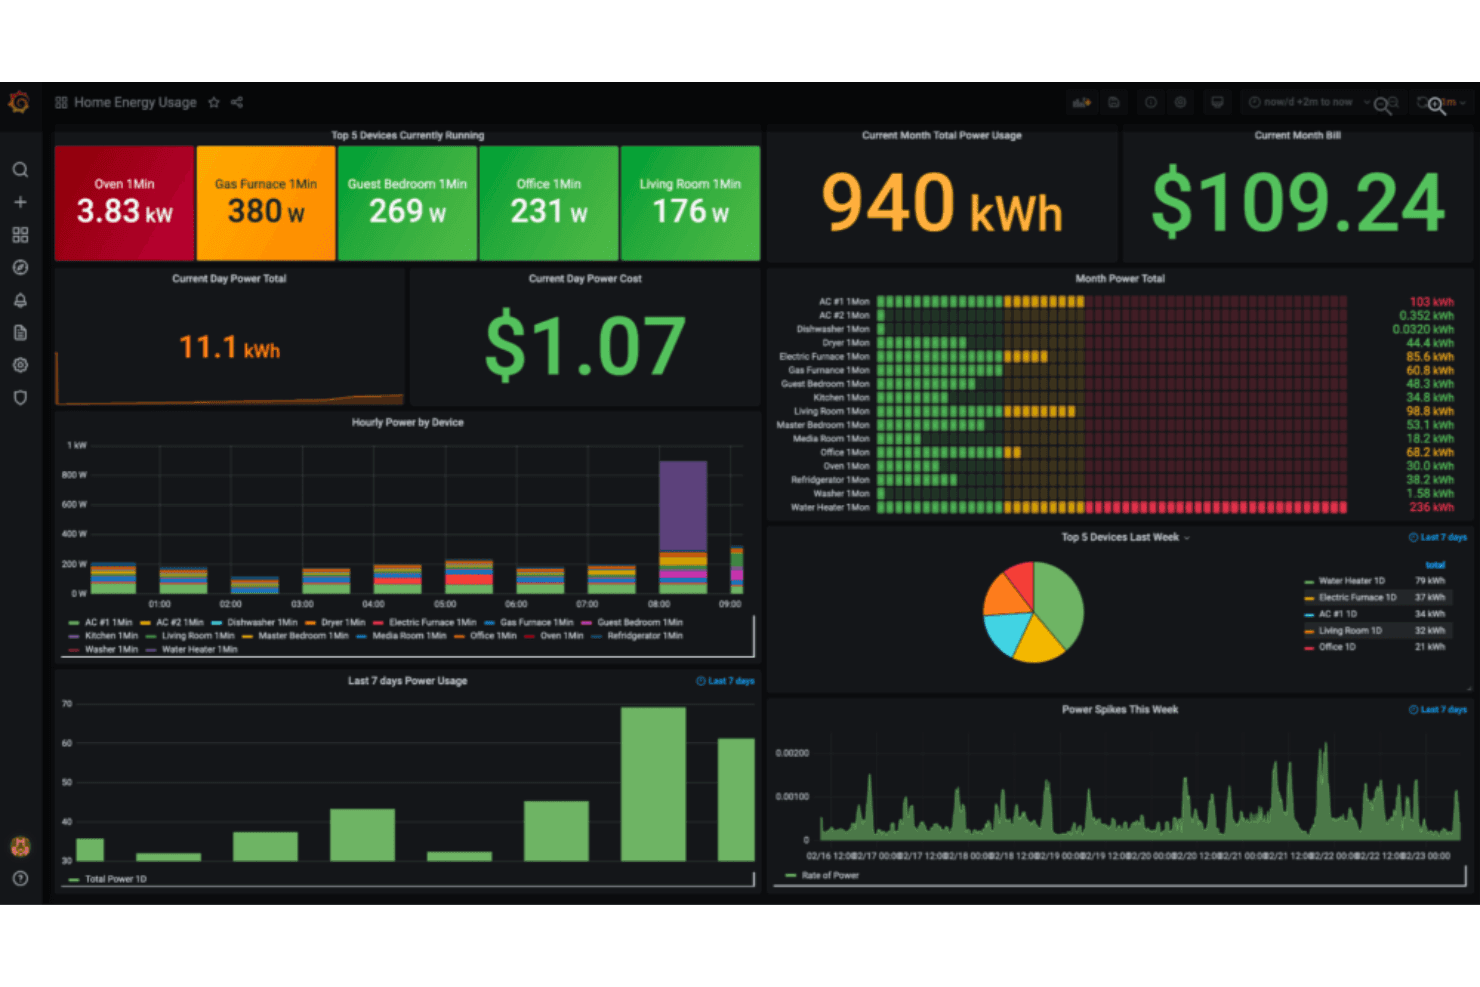
With its powerful visualization capabilities, Prometheus lets you create custom dashboards. This makes it easy for you to track key metrics at a glance.
Multi-Dimensional Data Model
Prometheus uses a flexible data model that lets you filter and aggregate data in multiple ways. This enhances your ability to analyze complex datasets.
Time-Series Database
Prometheus stores data in a time-series format, allowing for efficient querying and retrieval. This supports detailed historical analysis.
Query Language (PromQL)
PromQL lets you perform complex queries on your data, giving you deeper insights. This empowers you to solve problems more effectively.
Ease of Use
Prometheus offers powerful monitoring capabilities, but its user interface can be challenging for newcomers. The extensive customization and use of PromQL require a learning curve that might slow down your team initially. However, once you get the hang of it, the flexibility and depth of insights it provides are unmatched. Compared to other software, it demands more initial effort, but the control and precision you gain are well worth it for complex monitoring needs.
Integrations
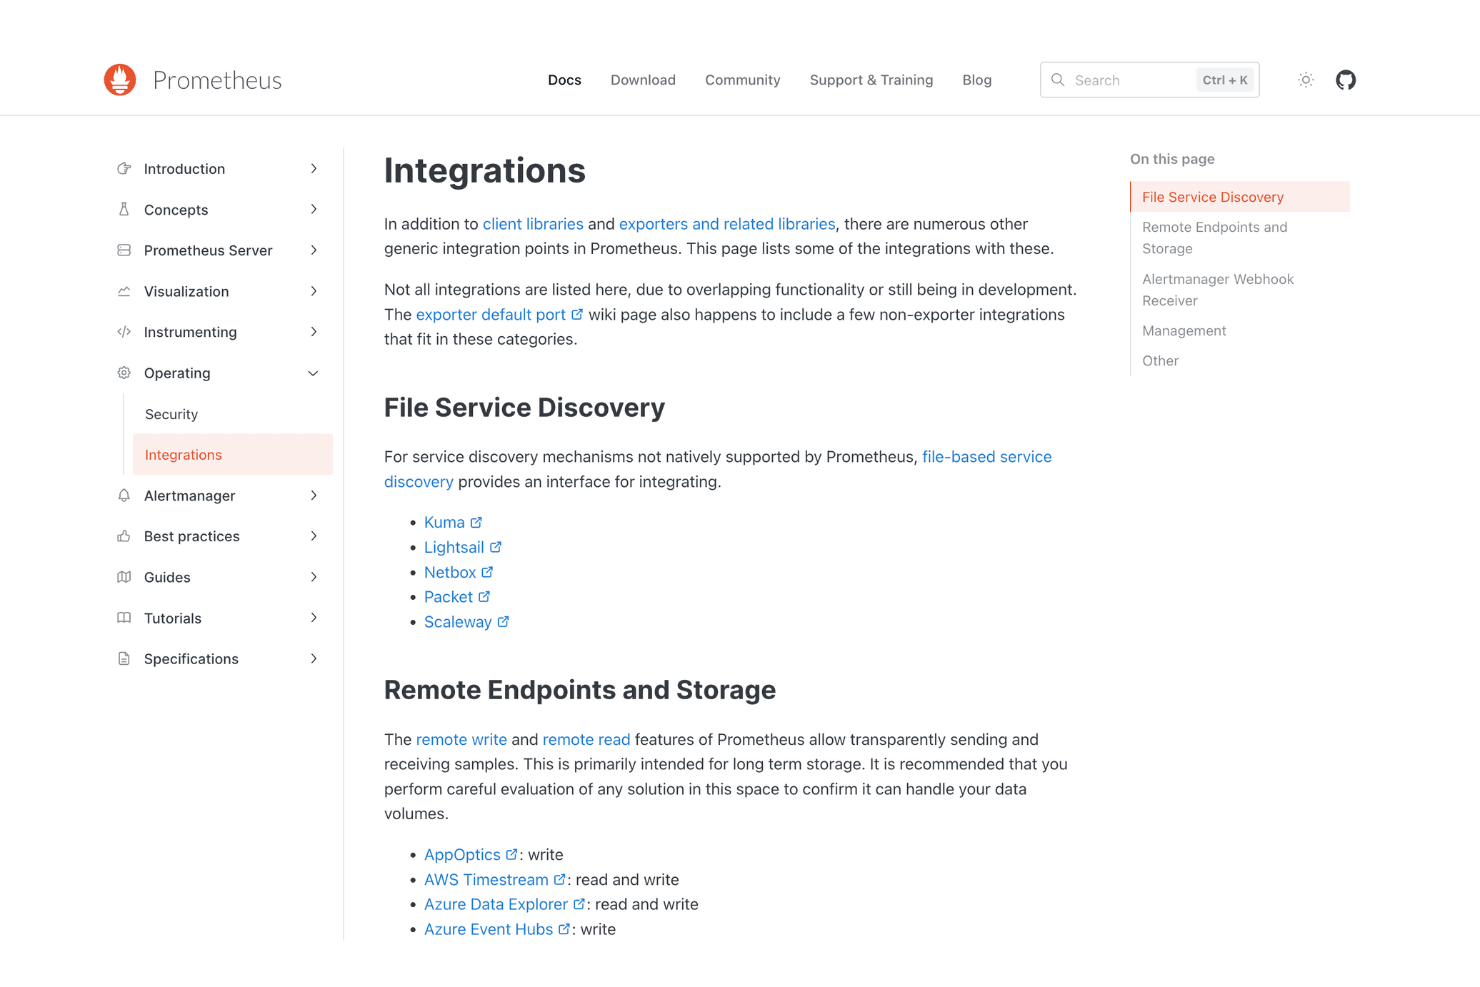
Integrations include MySQL, PostgreSQL, MongoDB, NVIDIA GPUs, Jenkins, JIRA, Kafka, RabbitMQ, Ceph, Gluster, AWS CloudWatch, and InfluxDB.
Prometheus Specs
- AI Integration: Yes
- API: Yes
- Automated Testing: No
- Browser Compatibility Testing: No
- Bug Tracking: No
- Code Review: No
- Custom Reports: Yes
- Data Export: Yes
- Data Import: Yes
- Developer Tools: Yes
- External Integrations: Yes
- Malware Protection: No
- Multi-User: Yes
- Notifications: Yes
- Performance Testing: No
- Process Reporting: No
- Static Analysis: No
- Status Notifications: No
- Workflow Management: No
Alternatives to Prometheus


Prometheus FAQs
Mitä seuraavaksi?
Kasvata SaaS-liiketoimintaasi ja kehitä johtamistaitojasi. Tilaa uutiskirjeemme, niin saat uusimmat näkemykset teknologiajohtajille ja tuleville teknologiajohtajille. Autamme sinua kasvattamaan toimintaasi älykkäämmin ja johtamaan vahvemmin huippuasiantuntijoiden oppaiden, resurssien ja strategioiden avulla!