10 Best AIOps Platforms of 2026

Best AIOps Shortlist


Managing IT operations has become more complex as systems grow larger and data increases. AIOps platforms make this easier by using artificial intelligence to monitor, analyze, and fix problems automatically.
With real-time insights and predictive alerts, AIOps helps teams detect issues early, automate responses, and maintain system health with less manual work. The result is a faster, more reliable, and more efficient IT environment.
This guide lists the top AIOps platforms available today, carefully selected for their reliability, ease of use, and advanced automation features. Each one is designed to help your team save time, cut costs, and keep your systems performing at their best.
Why Trust Our Software Reviews
We’ve been testing and reviewing software since 2023. As tech leaders ourselves, we know how critical and difficult it is to make the right decision when selecting software.
We invest in deep research to help our audience make better software purchasing decisions. We’ve tested more than 2,000 tools for different tech use cases and written over 1,000 comprehensive software reviews. Learn how we stay transparent & our software review methodology.
Best AIOps Platforms Tools Summary
| Tool | Best For | Trial Info | Price | ||
|---|---|---|---|---|---|
| 1 | Best for conversational IT issue resolution | 30-day free trial available | From $209/month/technician (billed annually) | Website | |
| 2 | Best for collaborative data science projects | 14-day free trial | Pricing upon request | Website | |
| 3 | Best for predictive analysis | 30-day free trial + free demo available | From $10/month (billed annually) | Website | |
| 4 | Best for ensuring data security compliance | 14-day free trial available | From $0.42/GB | Website | |
| 5 | Best for building AI-enabled workflows with integrations | 14-day free trial + free plan + free demo available | From $21/user/month | Website | |
| 6 | Best for root cause analysis and anomaly detection | Free 15-day trial | From $16/hybrid unit/month | Website | |
| 7 | Best for a range of AI-powered capabilities | Free demo available | Pricing upon request | Website | |
| 8 | Best for system alerts and notifications using machine logic | Free plan available | From $49/user/month | Website | |
| 9 | Best for multi-cloud environments | 14-day free trial + free demo available | Pricing upon request | Website | |
| 10 | Best for gaining operational insights across your infrastructure | Free demo available | From $9/user/month (billed annually) | Website |
-

TestDevLab
Visit Website -
Site24x7
Visit WebsiteThis is an aggregated rating for this tool including ratings from Crozdesk users and ratings from other sites.4.7 -
GitHub Actions
Visit WebsiteThis is an aggregated rating for this tool including ratings from Crozdesk users and ratings from other sites.4.8


Best AIOps Platforms Reviews
Here’s a brief description of the best AIOps platforms on the market. I’ve highlighted noteworthy features and provided screenshots to give you a feel of what each is like.
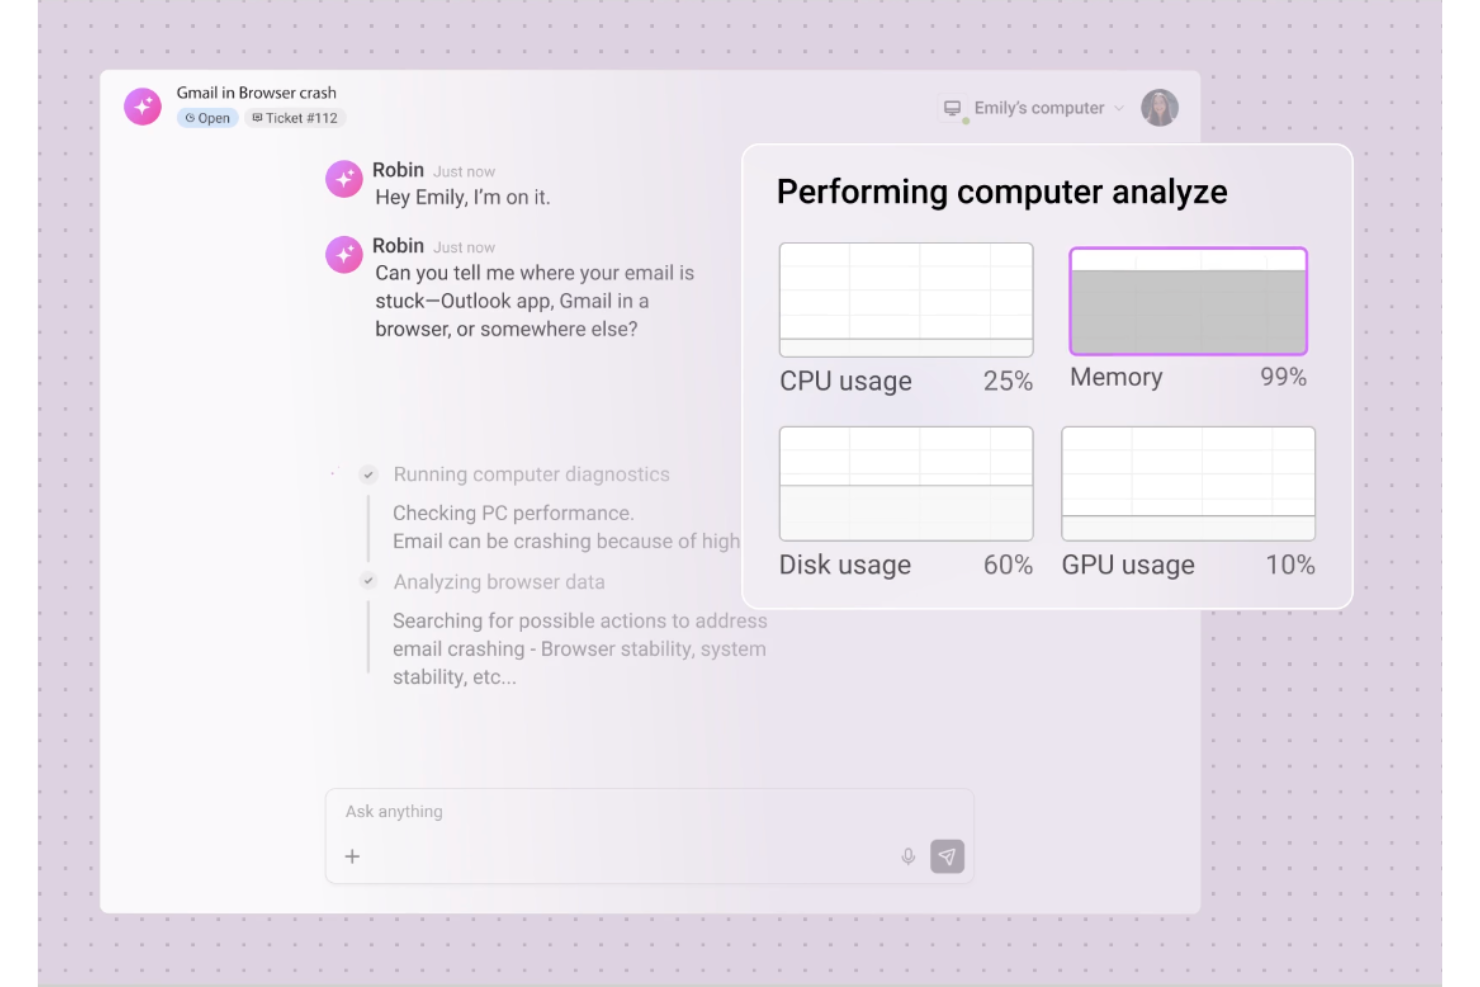
Robin Autonomous IT is Atera's autonomous IT service agent that diagnoses and resolves device and cloud issues end-to-end, with AI-driven triage, escalation summaries, and continuous learning from past tickets to support IT technicians.
Who Is Robin Autonomous IT Best For?
Robin Autonomous IT is a good fit for IT teams and managed service providers that handle high volumes of recurring service desk requests and need to reduce manual resolution workload.
Why I Picked Robin Autonomous IT
I've included Robin Autonomous IT in my top picks because of how it handles conversational IT resolution end to end. When an employee submits a request via Teams or Slack, Robin detects the intent, asks follow-up questions to gather full context, and immediately confirms the request is in progress. What I find genuinely impressive is that it doesn't just triage; it verifies the user against identity providers like Okta and Azure AD, then executes the fix directly on the device or in the cloud without waiting for a technician to step in.
Robin Autonomous IT Key Features
- Playbook-driven resolution engine: Robin follows predefined playbooks to select and execute the correct resolution path based on the issue type detected.
- Escalation with context handoff: When Robin can't resolve an issue autonomously, it escalates to a technician with a full diagnostic summary already attached to the ticket.
- Performance reporting dashboard: Track resolution rates, total actions executed, and time saved across all autonomous interactions in a dedicated reporting view.
- Continuous learning engine: Robin analyzes resolved tickets over time and surfaces suggestions for new scripts, playbooks, and knowledge base articles based on recurring patterns.
Robin Autonomous IT Integrations
Robin offers built-in integrations with identity providers like Google, Azure AD, and Okta, and supports request intake through Microsoft Teams, Slack, and WhatsApp. It also connects to CRM tools like HubSpot and third-party ITSM platforms, with additional connectivity available through Cloud Actions, MCP, and Zapier.
Pros and Cons
Pros:
- Learns from resolved tickets over time
- Executes actions directly on endpoints remotely
- Resolves tickets end-to-end without technician input
Cons:
- Performance may strain past 30 technicians
- Robin is a separate paid add-on
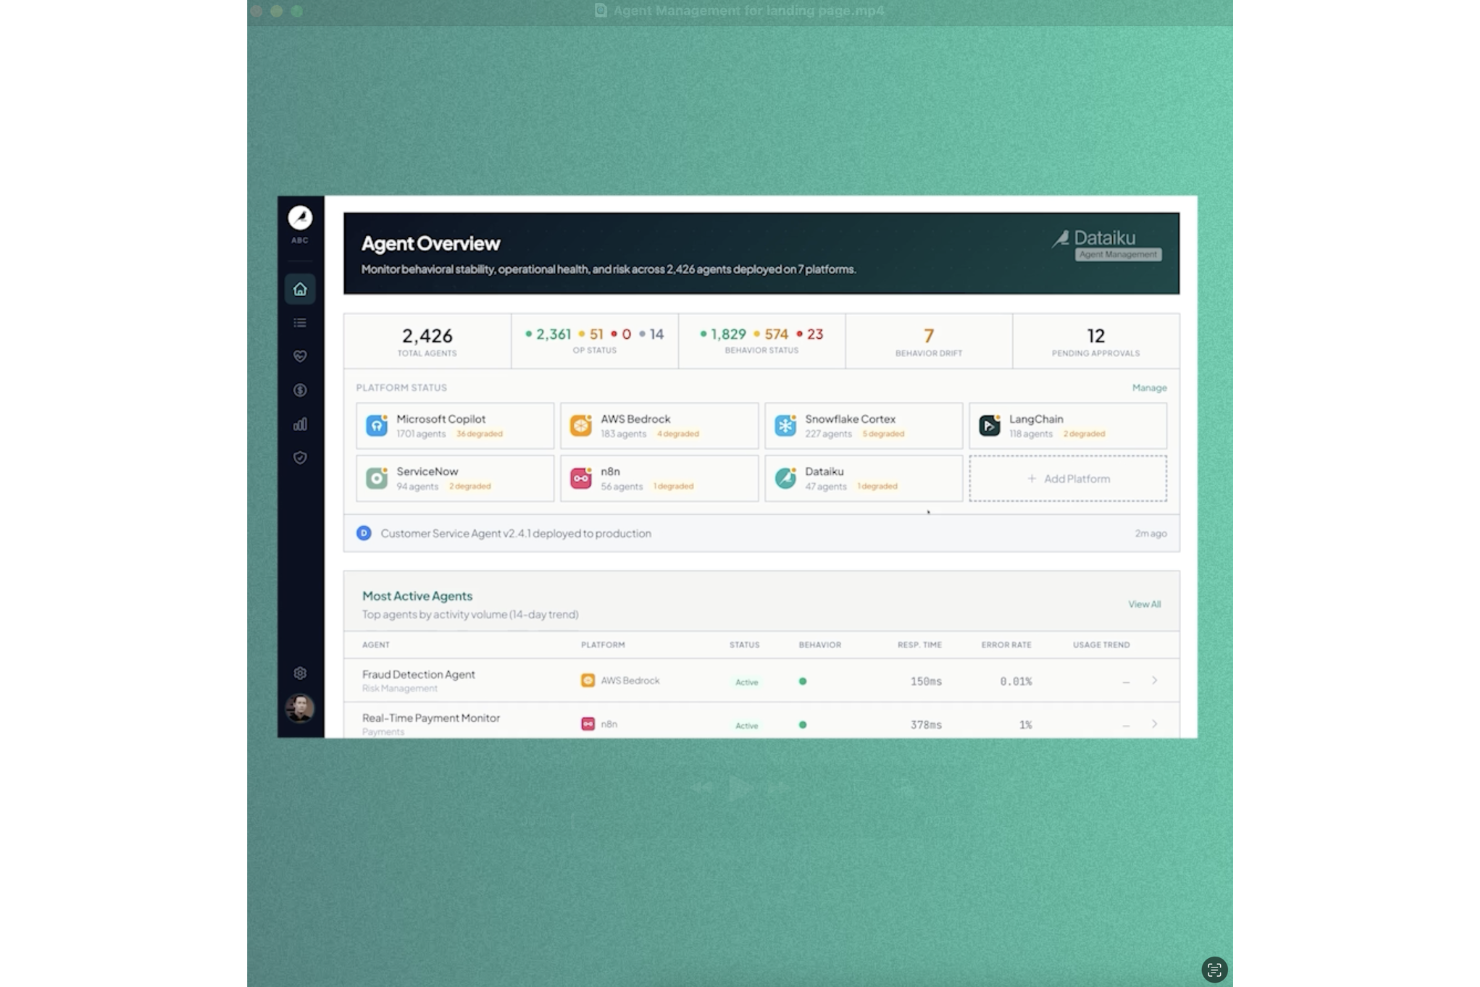
Dataiku is an AI development and operations platform that covers the full lifecycle from data preparation and model training through to deployment, monitoring, and multi-agent orchestration.
Who Is Dataiku Best For?
Dataiku is a strong fit for enterprise data science and AI engineering teams that need a shared platform for managing the full model lifecycle across large, cross-functional organizations.
Why I Picked Dataiku
I've included Dataiku in my top picks because it's one of the few AIOps platforms that puts collaboration at the center of the data science workflow. Analysts, data scientists, and engineers can all work inside the same project environment, using no-code, low-code, or full-code approaches, without fragmenting the work across separate tools. I particularly like the shared Flow, which gives every team member visibility into the full data and model pipeline. Built-in experiment tracking and lineage documentation mean my team isn't losing context as projects move from exploration to production.
Dataiku Key Features
- Model monitoring and drift detection: Track live model performance and receive automated alerts when predictions deviate from expected behavior.
- LLM Mesh: Centrally manage LLM access across providers, with built-in cost controls, usage monitoring, and safety guardrails.
- Scenario automation: Schedule and trigger automated workflows for data pipelines, model retraining, and deployment steps without manual intervention.
- AI governance controls: Apply automated documentation, stress testing, and audit trails to models across their full production lifecycle.
Dataiku Integrations
Dataiku offers native connectors for Salesforce, Jira, Zendesk, Splunk, ServiceNow, Snowflake, Databricks, Google BigQuery, Amazon S3, and SharePoint Online, along with connectors for many additional SQL, NoSQL, and cloud storage platforms. Zapier support is not built in, but Dataiku provides a public REST API and a plugin framework for custom integrations.
Pros and Cons
Pros:
- Covers full ML lifecycle in-platform
- Built-in AutoML speeds model development
- Supports visual and code-based workflows
Cons:
- Python API documentation lacks depth
- Slow processing with very large datasets

Site24x7 is a cloud-based monitoring solution that leverages artificial intelligence to oversee your entire IT infrastructure. It provides real-time insights into the performance of websites, servers, networks, and applications.
Why I picked Site24x7: One thing I like is its advanced anomaly detection capabilities. The system continuously monitors critical performance metrics and identifies deviations from normal behavior, alerting you to potential issues before they escalate. This proactive approach ensures that your IT operations remain smooth and uninterrupted. It also offers predictive analysis. By analyzing historical data, the platform forecasts future trends in resource utilization, such as disk and memory space.
Site24x7 Standout Features and Integrations:
Features include automated incident remediation, which uses simple scripts to resolve issues without manual intervention, reducing downtime and operational costs. The platform also offers data visualization and business intelligence tools, organizing critical data into charts, dashboards, and reports for quick analysis and troubleshooting.
Integrations include ServiceNow, PagerDuty, Opsgenie, Jira, ManageEngine AlarmsOne, ManageEngine ServiceDesk Plus, Slack, Microsoft Teams, Zoho Cliq, Amazon EventBridge, Zapier, and Webhooks.
Pros and Cons
Pros:
- Comprehensive monitoring capabilities across various IT infrastructure components
- Reliable real-time alerts that enable prompt issue resolution
- Flexible customization options for dashboards and reports
Cons:
- Configuration complexity can be challenging for new users
- Limited integration options with certain third-party tools
New Product Updates from Site24x7

Site24x7 Adds Discovery Issues for AWS Monitoring
Site24x7 added Discovery Issues for AWS monitoring, helping teams identify why resources are not being discovered across services and regions. The feature surfaces permission gaps, policy restrictions, and blocked API actions to support faster troubleshooting. For more information, visit Site24x7’s official site.
 .
.
Coralogix is a log management platform that helps organizations analyze their data at scale and ensure end-to-end security with automated incident response.
Why I picked Coralogix: I put Coralogix on this list because it automates posture assessments to ensure compliance with data security standards like SOC, ISO, and HIPAA. The TCO Optimizer feature lets you designate certain types of logs as compliance data.
Coralogix Standout Features and Integrations:
Features that differentiate Coralogix from other AIOps tools, in my opinion, are its automated vulnerability assessments. This feature uses AI to continuously monitor your log data and detect known security vulnerabilities; if it detects a vulnerability, it’ll display a description of the issue and estimate its severity so you can prioritize and remediate appropriately. I also like that it has 24/7 support built right into the app.
Integrations include over 100 native options to platforms and services like AWS, CircleCI, Jenkins, Microsoft Azure, PagerDuty, Perimeter 81, Cloudflare, and NXLog. You can use its REST APIs to connect to more applications.
Pros and Cons
Pros:
- Offers 24/7 in-app technical support
- Full range of features available with every plan
- Easy to set up pipelines to ingest data from multiple sources
Cons:
- Can be difficult to set up alerts and notifications
- Some users report slow speeds for log searches

PagerDuty is an infrastructure monitoring platform that leverages AI and ML to help companies stay ahead of critical issues and reduce manual processes.
Why I picked PagerDuty: Aggregating data across all the platforms and services you use isn’t easy, which is why I put PagerDuty on this list. It includes native integrations with over 700 tools and step-by-step instructions for popular platforms like AWS. You can also use its Events API v2 to ingest and process different types of event data.
PagerDuty Standout Features and Integrations:
Features that I feel make PagerDuty stand out from other AIOps tools include its intelligent alert grouping, which uses ML to group related alerts into a single incident. This helps reduce alert noise and speed up resolution times. Automation Actions is another feature I found helpful as it allows you to create automated incident response workflows to common issues; however, I should point out that this feature is only available as a paid-on.
Integrations are available natively for over 700 platforms, including AWS, ServiceNow, Salesforce, Zendesk, Atlassian, and Datadog.
Pros and Cons
Pros:
- Offers an extensive resource library of guides and documentation
- Pre-built ML models help reduce incident noise
- Allows for on-call scheduling to ensure incidents reach the right people
Cons:
- Automation Actions is charged separately as an add-on
- Free plan has limited functionality

LogicMonitor is a cloud-based infrastructure monitoring platform with AIOps capabilities that help organizations prevent outages and streamline their operations.
Why I picked LogicMonitor: I put LogicMonitor on this list for its anomaly detection. The system applies machine learning to historical data to detect anomalies outside normal patterns. Dynamic thresholds ensure that you only receive alerts for critical issues.
LogicMonitor Standout Features and Integrations:
Features that I think make LogicMonitor stand out from other AIOps platforms include its data forecasting tool, which uses historical data to make predictions about your infrastructure. For example, you can use it to anticipate when the disk space on a server will run out. These insights can help you take a more proactive approach to preventing outages.
Integrations are available natively for over 2,000 platforms. Notable integrations include Microsoft Azure, Google Cloud Platform, VMware, AWS, ServiceNow, Citrix, Fortinet, Java, MySQL, and ConnectWise.
Pros and Cons
Pros:
- Native integrations for 2,000 platforms and services
- Enables real-time monitoring of network devices, servers, and applications
- Offers an intuitive and simple user interface
Cons:
- Some users report additional development work for certain integrations
- Lack of customization for the monitoring templates
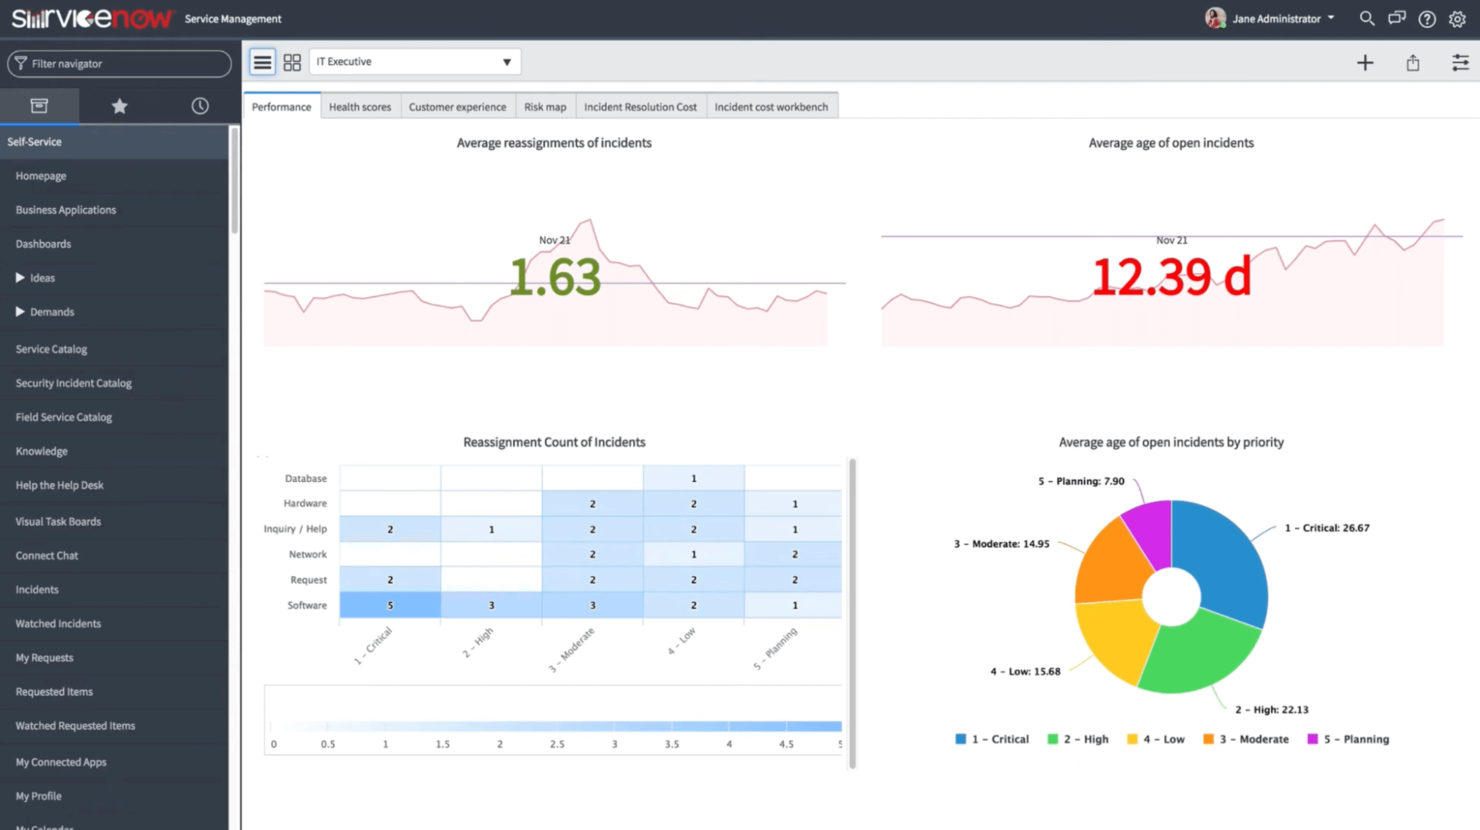
ServiceNow is a cloud-based IT operations management platform. It leverages AI to simplify data ingestion and automate incident resolution.
Why I picked ServiceNow: I put ServiceNow here because it offers an array of features that can help organizations manage and optimize their IT infrastructure. It can automatically discover applications and map their dependencies, detect and remediate anomalies, and even optimize resources to reduce cloud spend.
ServiceNow Standout Features and Integrations:
Features that I think make ServiceNow worth considering include its predictive AIOps capabilities, which can instantly identify anomalies as they occur. The platform also offers pre-built actions that you can apply to alerts and speed up remediation. I also found its service health dashboards helpful for understanding which applications were at risk.
Integrations are available natively for platforms like AWS, Google Cloud Platform, Microsoft Azure, Citrix, Okta, Jira, and SAP. You can also use ServiceNow’s REST APIs to integrate with more applications.
Pros and Cons
Pros:
- Offers apps for iOS and Android
- Facilitates collaboration and information sharing
- Platform can be customized to fit different use cases
Cons:
- Setting up integrations may require some technical expertise
- Some users report performance issues with the platform
Best for system alerts and notifications using machine logic

New Relic is a network observability platform that allows you to monitor the health of your infrastructure. It automatically detects anomalies and correlates incidents to streamline troubleshooting.
Why I picked New Relic: I picked New Relic because it does an excellent job at cutting through the “noise” and minimizing false positives. The platform uses an AI-powered correlation engine that reviews incidents and groups related issues to create a single alert. You can easily configure workflows to notify and provide relevant context to the right people so they can get straight to work.
New Relic Standout Features and Integrations:
Features that make New Relic stand apart include its issues feed, which provides a clear overview of the issues the system detected. I could drill down into each issue and get specifics like issue duration, entity type, and user actions. I also found its “postmortem” feature useful as it provided insights into what worked and what didn’t when responding to an incident.
Integrations include native options for various platforms and systems, including Amazon ECS, Elasticsearch, Synk, Kubernetes, Azure Batch, Google BigQuery, Kamon, and Comet.
Pros and Cons
Pros:
- Easy to set up and configure
- Offers simple and transparent pricing plans
- Provides full-stack observability across your infrastructure
Cons:
- Can be costly for small businesses
- Some users report inadequate documentation for advanced features

Splunk is an observability platform that uses AI and ML to detect anomalies and automate incident response across hybrid environments.
Why I picked Splunk: I chose Splunk because it offers a robust ecosystem of apps and integrations that enable multi-cloud enterprises to gain full visibility of their infrastructure. Its service-level dashboards allow you to drill down to the code level to make troubleshooting issues more effective.
Splunk Standout Features and Integrations:
Features that impressed me about Splunk include its predictive analytics tool, which uses ML algorithms to predict what the health score of a service may look like in 30 minutes. With these models, I could determine which services required immediate attention before an outage occurs. I also like that Splunk lets you create and add templates to standardize incident responses.
Integrations include pre-built and native applications that are available via Splunkbase — a marketplace of apps and add-ons for Splunk.
Pros and Cons
Pros:
- Offers flexible deployment options
- Has a range of pre-built and native integrations
- Powerful search and analytics capabilities
Cons:
- Requires training for users to utilize all features
- Uses a resource-intensive architecture
BigPanda
Best for gaining operational insights across your infrastructure

BigPanda’s AIOps tool uses intelligent automation to help organizations detect and resolve IT incidents to ensure continuous service availability.
Why I picked BigPanda: BigPanda has all the features you’d expect from an AIOps platform, like data aggregation, incident analysis, and alert correlation. But the reason I listed BigPanda here is because of its robust analytics and reporting. Its dashboard makes it easy to visualize key trends and understand the operational health of your infrastructure.
BigPanda Standout Features and Integrations:
Features that stood out to me about BigPanda during my testing are its generative AI that automatically creates titles and descriptions for incidents. You can give these descriptions a thumbs or down, which improves the AI-generated summary. I also like that the system conducts an incident analysis and surfaces probable root causes in real time.
Integrations are available natively with various platforms and services, such as Splunk, Nagios, Jenkins, Jira, ServiceNow, Slack, and Asana.
Pros and Cons
Pros:
- Offers a user-friendly and intuitive interface
- Performs automated incident analysis in real time
- Correlates and organizes IT alerts from various monitoring tools
Cons:
- Documentation isn’t as detailed for certain features
- Some users report slow response times from customer support
Other AIOps Software Options
Throughout my research, I evaluated a wide variety of tools. While these didn’t make my list of the top AIOps, I still think they’re worth checking out:
- Elastic Observability
For accelerating root cause analysis
- IBM Instana Observability
For automated full-stack observability
- Moogsoft
For leveraging AI and ML to automate incident response
- ignio AIOps
Closed-loop automation system
- Dynatrace
For enterprises to scale their operations with AI and ML
- Secoda
For maintaining data quality and governance
- Datadog
For growing startups to leverage AI
- Netreo
For ease of deploying an AIOps solution
- CloudFabrix
Generative AI for troubleshooting issues
- Zenoss
For full-stacking monitoring


Related AIOps Platform Reviews
If you still haven’t found what you’re looking for here, check out these other tools that we’ve tested and evaluated:
- IT Infrastructure Software
- IT Management Software
- DevOps Tools
- Cybersecurity Software
- Cloud Service Providers
- ETL Tools
- Data Integration Tools
How I Evaluate AIOps Platforms
I split my evaluation into baseline criteria—like ML-based anomaly detection and cross-source event correlation—and differentiating factors that separate the best platforms from the rest.
Core Functionality (Table Stakes For This List)
When I'm selecting tools for my list, I rank each one on a scale from 0 (does not offer the functionality) to 5 (excels in this area) for each core functionality listed below. Then, I calculate the tool's total score into a percentage. Each tool needs to achieve a minimum total score of 75% to be considered for inclusion.
- ML-Based Anomaly Detection: I evaluate whether the platform goes beyond static thresholds to detect unusual behavior—like a latency spike that only happens during batch processing windows.
- Event Correlation & Noise Reduction: Thousands of alerts from a single storage failure can bury a team. I look for AI-driven clustering that collapses related alerts into one actionable incident.
- Automated Root Cause Analysis: I check whether the tool traces issues across application, infrastructure, and network layers to surface probable causes rather than just flagging symptoms.
- Multi-Source Data Ingestion: A good AIOps platform should pull in metrics, logs, traces, and events from tools like Prometheus, Splunk, Datadog, and ServiceNow through pre-built connectors or open standards.
- Predictive Analytics & Forecasting: I look for ML models that can forecast resource exhaustion or performance degradation—catching a disk filling up days before it triggers an outage, for example.
- Automated Remediation: The platform should support triggering runbooks or scripts in response to known issue patterns, such as auto-restarting a failed service or scaling infrastructure on demand.
Once I have a list of tools that meet this criteria, I consider what sets each platform apart.
Differentiating Factors (What Sets Vendors Apart)
Here's how I compare and contrast different vendors:
Standout Features
I pay close attention to whether a platform offers real-time topology and dependency mapping. When a database goes down, seeing exactly which upstream services are affected saves hours of guesswork. Business service context matters just as much—I want to know if the tool can tie an infrastructure alert to a revenue-impacting SLA breach. Generative AI assistants are also increasingly useful, letting teams query incidents in plain language instead of writing complex search queries during high-pressure outages.
Beyond Features
Integration ecosystem depth is one of the first things I evaluate. An AIOps platform is only as useful as the data it can access, so I check for native connectors to tools like ServiceNow, PagerDuty, and Prometheus alongside OpenTelemetry support. Security and compliance certifications also weigh heavily—teams in regulated industries need SOC 2 Type II, RBAC, and audit logging at a minimum. I also consider time-to-value, specifically whether the platform ships with pre-trained models or requires months of tuning before delivering actionable insights.
How to Choose AIOps Platform
It’s easy to get bogged down in long feature lists and complex pricing structures. To help you stay focused as you work through your unique software selection process, here’s a checklist of factors to keep in mind:
| Factor | What to Consider |
|---|---|
| Scalability | Can the platform grow with your business? Consider future needs and ensure the tool won't cap your growth. Look for platforms that handle increased data and user loads. |
| Integrations | Does it work with your existing systems? Check for compatibility with key tools you already use. Missing integrations can mean manual workarounds. |
| Customizability | Can you tailor the platform to your workflows? Ensure it supports your processes without excessive customization costs or complexity. |
| Ease of use | Is the platform intuitive for your team? Evaluate the learning curve and whether the interface aligns with your team's skill level. |
| Implementation and onboarding | How quickly can you get started? Consider the time and resources needed for setup, training, and adoption. Look for support options to ease the transition. |
| Cost | Does the pricing fit your budget? Compare costs against features offered. Beware of hidden fees or pricing tiers that limit essential features. |
| Security safeguards | Are data protection measures up to par? Ensure the platform complies with industry standards and offers features like encryption and access controls. |
| Support availability | Will you get help when needed? Check for 24/7 support options and multiple contact methods. Quick, reliable support can save time in critical situations. |
What Are AIOps Platforms?
AIOps platforms are software solutions that use artificial intelligence (AI) and machine learning (ML) to automate IT processes. Advanced algorithms enable these platforms to detect issues, conduct root cause analysis, and propose solutions faster than humanly possible. This allows IT teams to quickly respond to incidents and reduce the mean time to resolve (MTTR).
Features
When selecting AIOps platforms, keep an eye out for the following key features:
- Anomaly detection: Identifies irregular patterns in data to alert teams of potential issues before they escalate.
- Root cause analysis: Pinpoints the underlying cause of incidents, helping teams resolve issues faster and more accurately.
- Automated incident response: Uses AI to automatically address common problems, reducing the need for manual intervention and speeding up resolution times.
- Predictive analytics: Anticipates future problems by analyzing historical data, allowing teams to proactively manage IT operations.
- Real-time monitoring: Provides up-to-the-minute insights into system performance, enabling quick reactions to any changes or incidents.
- Customizable dashboards: Offers personalized views of data and metrics, making it easier for teams to focus on what's important to them.
- Integration capabilities: Connects with existing tools and systems to create a cohesive IT environment, reducing silos and improving efficiency.
- Self-healing capabilities: Automatically resolves detected issues to maintain system stability and reduce downtime.
- Compliance checks: Ensures that IT operations align with industry regulations, minimizing the risk of compliance violations.
- Scalability: Supports growing data and user demands, ensuring the platform remains effective as your organization expands.
Benefits
Implementing AIOps platforms provides several benefits for your team and your business. Here are a few you can look forward to:
- Reduced downtime: Automated incident response and real-time monitoring lead to quicker issue resolution, minimizing system downtime.
- Improved efficiency: Features like anomaly detection and root cause analysis help teams focus on resolving issues rather than finding them, enhancing productivity.
- Proactive management: Predictive analytics allow teams to anticipate and address potential problems before they affect operations.
- Enhanced decision-making: Customizable dashboards provide clear insights, enabling informed decisions based on real-time data and analytics.
- Cost savings: By automating routine tasks and optimizing resource use, AIOps platforms help reduce operational costs.
- Compliance assurance: Built-in compliance checks ensure that IT operations meet industry standards, reducing the risk of violations.
- Scalability: The ability to handle growing data and user demands ensures that the platform remains effective as your organization grows.
Costs & Pricing
Selecting AIOps platforms requires an understanding of the various pricing models and plans available. Costs vary based on features, team size, add-ons, and more. The table below summarizes common plans, their average prices, and typical features included in AIOps platforms solutions:
Plan Comparison Table for AIOps Platforms
| Plan Type | Average Price | Common Features |
|---|---|---|
| Free Plan | $0 | Basic monitoring, limited alerts, and community support. |
| Personal Plan | $5-$25/user/month | Anomaly detection, customizable dashboards, and email support. |
| Business Plan | $30-$60/user/month | Root cause analysis, real-time monitoring, and integration with third-party tools. |
| Enterprise Plan | $70-$150/user/month | Predictive analytics, advanced automation, compliance checks, and dedicated account management. |
AIOps Tool FAQs
Here are some answers to frequently asked questions about AIOps:
How long does it take to implement an AIOps platform?
Implementation time depends on the size of your IT infrastructure and the complexity of your systems. Small teams may take a few weeks, while large enterprises could need several months to fully integrate and fine-tune their workflows.
Do AIOps platforms require coding or technical expertise?
Most modern AIOps platforms are designed with user-friendly dashboards and automation templates. However, some customization or setup may still require technical input, especially when integrating with existing monitoring tools or APIs.
Can AIOps support business continuity planning?
Yes. AIOps platforms play a key role in maintaining business continuity by identifying risks early, automating recovery actions, and ensuring that systems remain operational during outages or unexpected failures.
How do AIOps tools help reduce alert fatigue?
AIOps uses correlation and noise reduction to group related alerts and eliminate duplicates. This helps teams focus only on meaningful incidents instead of being overwhelmed by excessive notifications.
Are AIOps platforms suitable for small or mid-sized businesses?
Yes. While AIOps originated in enterprise settings, many providers now offer scalable plans for smaller organizations. These tools help lean teams achieve enterprise-level monitoring and automation without large upfront costs.
How do AIOps solutions impact compliance and auditing?
AIOps platforms simplify compliance management by maintaining detailed system logs, automating reporting, and ensuring consistent adherence to policies. This makes audits faster and more accurate.
Can AIOps tools integrate with existing ITSM or DevOps systems?
Most AIOps platforms are built for seamless integration with IT service management (ITSM) and DevOps tools such as ServiceNow, Jira, and PagerDuty. This ensures smooth workflows without disrupting existing processes.
What kind of data do AIOps platforms analyze?
AIOps platforms process a wide range of data including logs, metrics, events, alerts, and traces. By combining these sources, they provide a unified view of system health and performance trends.
What’s Next:
If you're in the process of researching AIOps platforms, connect with a SoftwareSelect advisor for free recommendations.
You fill out a form and have a quick chat where they get into the specifics of your needs. Then you'll get a shortlist of software to review. They'll even support you through the entire buying process, including price negotiations.