

As ferramentas de monitorização de APIs ajudam a acompanhar o desempenho e o estado das suas APIs, para que possa detetar problemas atempadamente e manter os seus serviços a funcionar sem problemas.
Muitas equipas começam a procurar estas ferramentas quando enfrentam problemas como períodos de indisponibilidade que não detetaram a tempo, erros causados por alterações em APIs externas ou falhas na monitorização entre ambientes. Sem a solução adequada, é fácil não detetar os sinais de alerta até os utilizadores apresentarem reclamações.
Testei estas ferramentas em configurações locais e na nuvem, prestando especial atenção à forma como lidam com tráfego e alertas do mundo real. Neste guia, partilharei o que se destacou, o que ficou aquém das expectativas e como encontrar uma ferramenta que se adapte à sua pilha tecnológica e ao seu fluxo de trabalho.
Why Trust Our Software Recommendations
6,700+
Reviews
20
Industry experts
16+
Evaluation factors
14
Years
Our team has been testing and reviewing software since 2012. As tech leaders ourselves, we know how difficult—and important—it is to choose the right software.
For this guide, we evaluated tools using hands-on testing and independent research, scoring tools using our selection criteria.
Our reviews reflect our human editorial judgment, not a sales pitch.
Expert reviewers:
- Paulo Gardini MiguelTech Director
 Tim FisherVP of AI
 Gabriel RosasTech Lead & Software Architect
 Christhian GruhnTech Lead & Platform Architect

Tabela de comparação das ferramentas de monitorização de APIs
| Tool | Best For | Trial Info | Price | ||
|---|---|---|---|---|---|
| 1 | Best for AI-driven anomaly detection for APIs | Free plan + 30-day free trial available | From $200/month (billed annually) | Website | |
| 2 | Best for multi-gateway API monitoring | Free demo available | Pricing upon request | Website | |
| 3 | Best for multi-step transaction monitoring | Free plan + 30-day trial + demo available | From $10/month | Website | |
| 4 | Best for uptime monitoring and detailed reports | 30-day free trial + demo available | From $10/month | Website | |
| 5 | Best for cloud-scale synthetic monitoring | Free plan available | From $15/month (billed annually) | Website | |
| 6 | Best for actionable insights with intelligent alerting | Free trial available | Pricing upon request | Website | |
| 7 | Best for real-time API performance insights | Free plan available | From $77/month (billed annually) | Website | |
| 8 | Best for enterprise-grade API lifecycle management | 30-day free trial + free demo available | Pricing upon request | Website | |
| 9 | Best for real-time data visualization and search capabilities | 7-day free trial available | Pricing upon request | Website | |
| 10 | Best for developer-friendly API testing and monitoring | Free plan available | From $9/month (billed annually) | Website |


Análises das melhores ferramentas de monitorização de APIs
 Best for AI-driven anomaly detection for APIs
- Free plan + 30-day free trial available
- From $200/month (billed annually)
Visit WebsiteCustomer Rating:4.6/5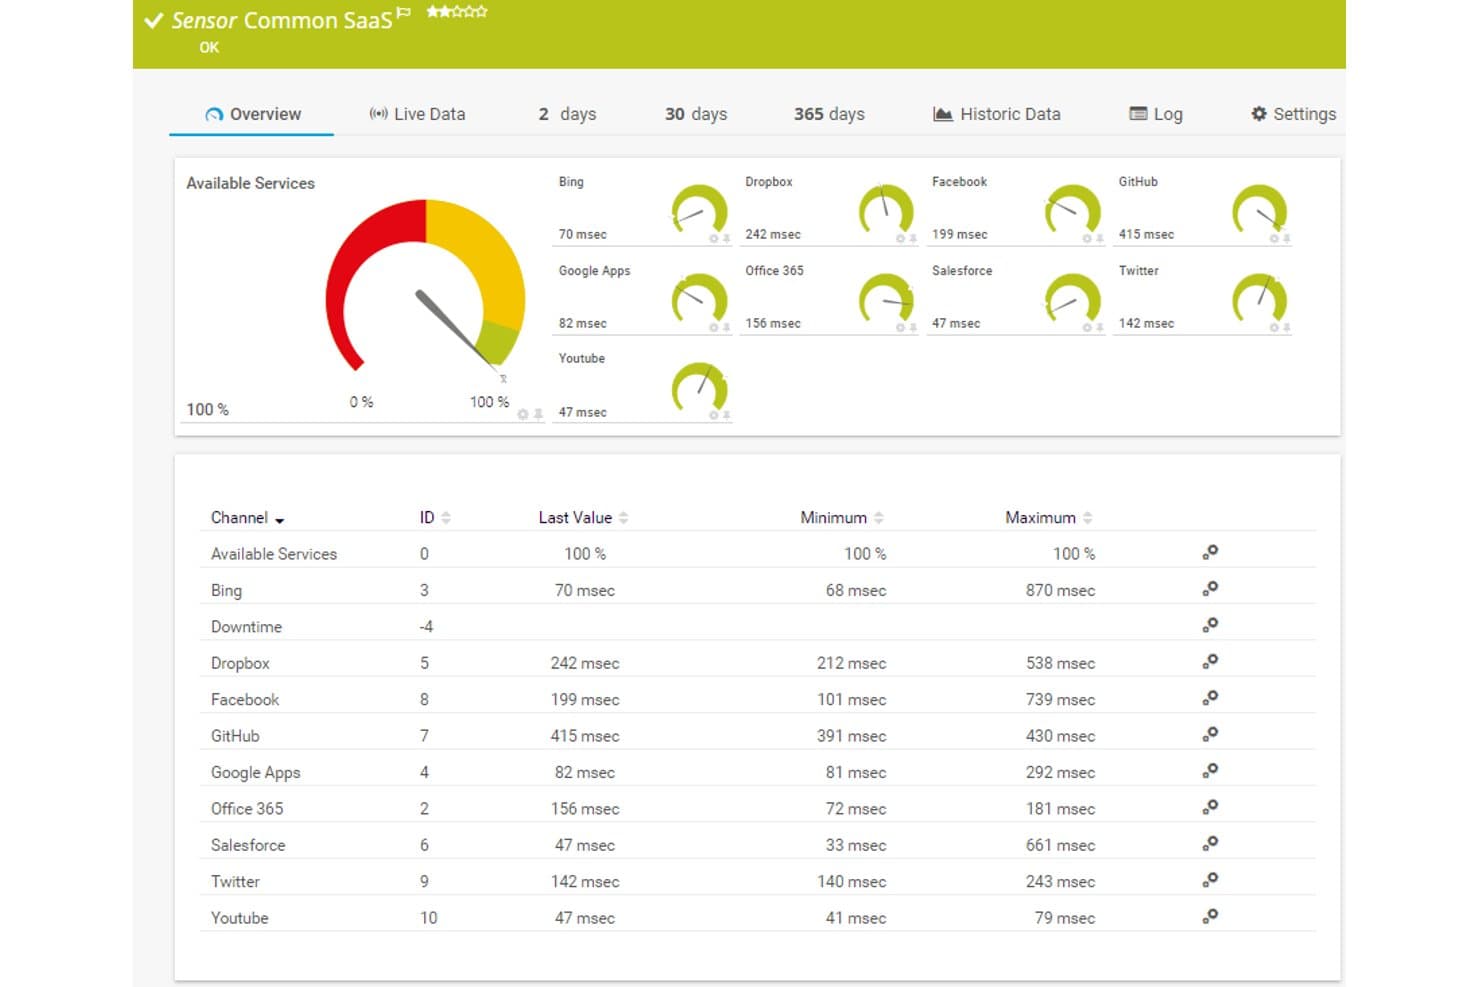
Paessler PRTG offers a Common SaaS sensor dashboard displaying real-time response times and availability for cloud services like Dropbox, Office 365, Salesforce, and GitHub. Paessler PRTG is a unified IT infrastructure monitoring platform that tracks API endpoints, network devices, servers, and applications using sensors for REST APIs, SNMP, WMI, and HTTP protocols.
Who Is Paessler PRTG Best For?
PRTG is a strong fit for infrastructure and IT operations teams in mid-to-large enterprises that need to monitor APIs alongside broader network and server environments.
Why I Picked Paessler PRTG
I picked Paessler PRTG because its AI-driven anomaly detection goes beyond static thresholds. The platform learns baseline behavior for each API sensor, so when response times or error rates deviate from normal patterns, PRTG flags it automatically. I particularly like how the REST Custom v2 sensor maps JSON response values to individual channels, giving that anomaly detection engine granular, per-metric data to analyze rather than treating an entire API call as a single data point.
Paessler PRTG Key Features
- REST Custom v2 sensor: Monitors any REST API endpoint and maps returned JSON or XML fields as custom monitoring channels.
- Custom alerting rules: Triggers notifications via email, SMS, or push based on fully configurable sensor states and thresholds.
- Flexible deployment options: Offers SaaS (PRTG Hosted Monitor), on-premise, and hybrid installation for enterprise and security-sensitive environments.
- Extensive protocol support: Supports SNMP, WMI, NetFlow, MQTT, OPC UA, and more to monitor a broad range of IT and OT endpoints.
Paessler PRTG Integrations
Paessler PRTG offers native integrations with PagerDuty, Opsgenie, AWS CloudWatch, Azure Monitor, and has an API for custom integrations.
Pros and Cons
Pros:
- Per-channel JSON mapping gives granular API insights
- Supports on-premise deployment for air-gapped environments
- AI anomaly detection without manual threshold configuration
Cons:
- Sensor-based setup takes manual configuration time
- Weak native synthetic multi-step API workflow testing
Learn more about Paessler PRTG: Best for multi-gateway API monitoring
- Free demo available
- Pricing upon request

DigitalAPI provides visibility into API quality, usage, and gateway performance across your API estate. DigitalAPI provides a versatile platform for businesses that want to improve how they manage APIs, covering everything from discovery to monetization. Built with regulated industries like healthcare and banking in mind, it offers a unified control system and a developer portal that simplifies API deployment. This makes it a solid option for enterprises that need strong governance and security across their API operations.
Why I Picked DigitalAPI
I chose DigitalAPI for its centralized API governance and detailed analytics, both of which are essential for effective monitoring. The unified control system lets you manage APIs across multiple gateways while maintaining consistency and security. Its analytics provide clear visibility into API performance, making it easier to spot and resolve issues quickly. Together, these capabilities make DigitalAPI a strong choice for teams focused on improving API monitoring.
DigitalAPI Key Features
In addition to its governance and analytics capabilities, I also found several other features beneficial for API monitoring:
- API Marketplace: Enables API monetization through an external platform, helping expand revenue opportunities.
- Developer Portal: Offers a central hub where developers can access APIs, making integration and management more straightforward.
- One-Click Deployment: Streamlines API deployment across multiple gateways, reducing time and operational effort.
- AI Integration: Adds artificial intelligence capabilities to APIs, supporting advanced functionality and automation.
DigitalAPI Integrations
Native integrations are not currently listed by DigitalAPI.
Pros and Cons
Pros:
- Helix Gateway supports full lifecycle
- Detailed analytics for API performance
- Centralized governance across multiple gateways
Cons:
- Pricing details not publicly available
- No listed native integrations
Learn more about DigitalAPI: Best for multi-step transaction monitoring
- Free plan + 30-day trial + demo available
- From $10/month
Visit WebsiteCustomer Rating:4.7/5
Site24x7 tracks multi-step API transactions to monitor response time and errors. Site24x7 is an ideal solution for businesses seeking to ensure their APIs run smoothly and reliably, with support for multi-step transaction monitoring to track API workflows more effectively. If you're in an industry where consistent application performance is important, Site24x7's API monitoring tools help you observe and troubleshoot API behavior in real time, addressing issues before they affect users. By using its capabilities, you can maintain service availability and keep your team focused on delivering reliable digital experiences.
Why I Picked Site24x7
I picked Site24x7 for its multi-step transaction monitoring, which helps track API workflows across sequential requests. The platform also supports monitoring REST, SOAP, gRPC, and WebSocket APIs, allowing you to observe response times and error rates. Its alerting system notifies you when performance issues occur, helping teams address problems early. These capabilities make Site24x7 useful for businesses that depend on stable API integrations.
Site24x7 Key Features
In addition to multi-step transaction monitoring, Site24x7 offers:
- Global Monitoring Locations: With over 130 locations worldwide, you can ensure your APIs perform optimally for users worldwide.
- Content Validation: Site24x7 checks if the API response contains the expected content, ensuring data integrity.
- Instant Notifications: Get immediate alerts for any API performance issues, allowing you to respond swiftly and maintain service quality.
Site24x7 Integrations
Integrations include ServiceNow, PagerDuty, Jira, Slack, Microsoft Teams, AWS, Azure, Kubernetes, and more.
Pros and Cons
Pros:
- Quick setup process covers websites and cloud resource monitoring
- AI-powered full-stack monitoring supports multicloud infrastructure management
- Flexible monitoring integrates easily with multiple infrastructure components
Cons:
- Complex configuration slows initial setup and platform understanding
- Alert bugs cause issues when adding new monitoring configurations
Learn more about Site24x7: Best for uptime monitoring and detailed reports
- 30-day free trial + demo available
- From $10/month
Visit WebsiteCustomer Rating:4.5/5
Pingdom API monitoring tool uptime tracking Pingdom is primarily recognized for its prowess in uptime monitoring, ensuring that APIs and websites remain operational. Paired with this is its capability to generate in-depth reports, providing users with a detailed understanding of their API's performance.
Why I Picked Pingdom: In my quest for reliable monitoring tools, Pingdom's dedication to uptime monitoring, complemented by its detailed reporting, was undeniable. I appreciated its straightforward approach to delivering timely insights about any downtimes. For teams that prioritize constant uptime and comprehensive reporting, Pingdom is clearly the go-to tool.
Standout Features & Integrations:
Pingdom excels with its real-time monitoring that instantly notifies users of downtimes. Its root cause analysis helps in troubleshooting issues swiftly.
Integration-wise, Pingdom collaborates with platforms such as Slack, Opsgenie, and PagerDuty.
Pros and Cons
Pros:
- Flexible alerting system
- Detailed root cause analysis
- Accurate real-time uptime monitoring
Cons:
- Historical data retention varies with pricing tiers
- Advanced features limited to higher-tier plans
- Mobile apps can sometimes lag
Learn more about Pingdom: Best for cloud-scale synthetic monitoring
- Free plan available
- From $15/month (billed annually)
Visit WebsiteCustomer Rating:4.5/5
Global performance dashboard of Datadog API monitoring tool Datadog offers an impressive platform primarily centered around cloud monitoring. Its synthetic monitoring feature stands out, helping businesses to simulate user interactions and track application and API performance at a cloud scale.
Why I Picked Datadog: In my search for cloud-focused monitoring solutions, Datadog's capabilities were hard to overlook. Its emphasis on cloud-scale synthetic monitoring and the breadth of its feature set made it a clear choice. It is my opinion that Datadog is the top choice for businesses needing to simulate and monitor performance in cloud environments.
Standout Features & Integrations:
Datadog’s synthetic monitoring can simulate interactions from global locations, ensuring performance consistency worldwide. The tool’s visualizations, including flame graphs, provide deep insights into application performance.
Integration-wise, Datadog supports a myriad of platforms including AWS, Azure, Google Cloud, and numerous third-party integrations.
Pros and Cons
Pros:
- Powerful visualization tools for performance analysis
- Wide range of cloud integrations
- Advanced synthetic monitoring capabilities
Cons:
- Some configurations can require advanced technical know-how
- The vastness of features might be daunting for beginners
- Can be pricey for smaller organizations
 Best for actionable insights with intelligent alerting
- Free trial available
- Pricing upon request
Visit WebsiteCustomer Rating:2/5
Smartbear's dashboard Smartbear has cemented its position in the API world as a sophisticated tool that offers in-depth analytics combined with sharp alerting mechanisms. Converging advanced monitoring with intelligent alerts, aids teams in not just identifying but also acting upon issues efficiently.
Why I Picked Smartbear: In my pursuit of the best monitoring tools, Smartbear's capability to offer actionable insights caught my eye. When choosing, I appreciated its robust alerting system that goes beyond the ordinary, making it a cut above the rest. It's clear to me that Smartbear is the optimal choice for those teams that prioritize actionable insights complemented by intelligent alerting.
Standout Features & Integrations:
Smartbear brings to the table advanced performance monitoring, which includes API uptime, functionality, and data validation checks. Additionally, its synthetic monitoring can simulate complex user scenarios across various endpoints.
For integrations, Smartbear connects effectively with platforms like Slack, JIRA, and PagerDuty.
Pros and Cons
Pros:
- Simulates complex user journeys with ease
- Robust and timely alerting mechanisms
- Deep analytical insights
Cons:
- Some users might find the UI less intuitive
- Limited features in the base plan
- Slightly steep learning curve for beginners
Learn more about SmartBear: Best for real-time API performance insights
- Free plan available
- From $77/month (billed annually)
Visit WebsiteCustomer Rating:4.5/5
Users can view real-time API insights directly within Treblle's dashboard. Treblle is an end-to-end APIOps platform designed to assist engineering and product teams in managing their REST APIs efficiently. It provides comprehensive tools for API observability, governance, analytics, and security.
Why I Picked Treblle: It offers real-time API monitoring, which provides insights into API performance and activity. This allows teams to quickly identify and address issues as they arise, minimizing downtime and ensuring a smooth user experience. Treblle's detailed logging and error-tracking capabilities further enhance its monitoring by capturing and alerting teams to code-based errors.
Standout Features & Integrations:
Key features include the ability to analyze over 40 API-specific data points for every request and collaboration tools like request tracing, tagging, and commenting for effective teamwork and streamlined debugging processes. Additionally, the automated API development feature ensures that documentation and endpoint data are always current.
Integrations include PHP, Laravel, Lumen, Symfony, JavaScript, Node.js, Express, Fastify, Koa, AdonisJS, NestJS, Strapi, .NET, Python, Django, Flask, Ruby, Java, and Spring.
Pros and Cons
Pros:
- Automates the documentation process
- Has a detailed and comprehensive dashboard
- Provides real-time monitoring capabilities
Cons:
- Could offer better alerting integrations
- Limited customization options for certain features
Learn more about Treblle: Best for enterprise-grade API lifecycle management
- 30-day free trial + free demo available
- Pricing upon request

IBM API Connect's dashboard IBM API Connect is a comprehensive solution tailored for businesses that demand enterprise-level management of their API lifecycle. It facilitates the creation, deployment, management, and monitoring of APIs, with a clear focus on catering to large-scale enterprise needs.
Why I Picked IBM API Connect: When evaluating tools for API lifecycle management, IBM API Connect was an evident standout due to its robust features tailored for large-scale operations. My decision was swayed by its reputation for being a trusted choice for enterprises. In my judgment, for businesses that require end-to-end control over their API lifecycle with enterprise-grade robustness, IBM API Connect excels.
Standout Features & Integrations:
IBM API Connect offers a unified dashboard that provides insights into API health, usage, and overall performance. Its in-built developer portal promotes API adoption and collaboration.
For integrations, it supports connectivity with IBM Cloud services, Watson AI, and enterprise databases.
Pros and Cons
Pros:
- Robust analytics and monitoring tools
- Integrated developer portal for increased collaboration
- Comprehensive API lifecycle management
Cons:
- Initial setup and integration can be time-consuming
- The pricing structure can be complex for some users
- Might be overwhelming for small-scale operations
Learn more about IBM API Connect: Best for real-time data visualization and search capabilities
- 7-day free trial available
- Pricing upon request

Kibana's overview dashboard for the monitoring tab Kibana, a brainchild of the Elastic Stack, plays a crucial role in visualizing Elasticsearch data. Its prowess in real-time data visualization, paired with superior search capabilities, helps tech teams delve deeper into their data than ever.
Why I Picked Kibana: Navigating through the sea of API monitoring tools, Kibana caught my attention due to its intuitive and dynamic visualizations. I selected this tool based on its unique strength in helping users understand and act on their data.
When weighing its merits, it became clear that Kibana is genuinely best for those who value real-time data visualization and potent search mechanisms.
Standout Features & Integrations:
Kibana's dashboard offers a customizable workspace to visualize, navigate, and dissect complex data. Its Lens feature brings drag-and-drop capabilities to data visualization. Moreover, Kibana integrates with Elasticsearch, Logstash, and Beats, enhancing its utility manifold.
Pros and Cons
Pros:
- Powerful search across vast datasets
- Deep integration with the Elastic Stack
- Dynamic real-time data visualization
Cons:
- Advanced features demand a steeper learning curve
- Requires an Elastic Stack setup for maximum benefit
- Might feel overwhelming for beginners
Learn more about Kibana: 10Best for developer-friendly API testing and monitoring
Postman
- Free plan available
- From $9/month (billed annually)

Postman API monitoring tool reporting dashboard Postman has etched its name in the tech industry as a developer's trusted companion for API testing. With its intuitive design, it facilitates both testing and monitoring, ensuring APIs function as intended.
Why I Picked Postman: Selecting tools for this list demanded a keen eye for utility, and Postman's developer-centric approach was hard to overlook. I chose it because of its user-friendly design that simplifies the complex realm of API testing. My judgment is that for those seeking a blend of simplicity and efficacy in API testing and monitoring, Postman remains a frontrunner.
Standout Features & Integrations:
Postman's collection runs enable automated testing, while its mock servers simulate API responses without any backend. The tool also integrates well with popular CI/CD platforms, ensuring testing in development pipelines. Key integrations include platforms like Jenkins, Travis CI, and CircleCI.
Pros and Cons
Pros:
- Robust integration with CI/CD platforms
- Comprehensive testing tools including mock servers
- Developer-friendly interface
Cons:
- Advanced features may require a learning curve
- Large collections can slow down the app
- Monitoring features can be basically compared to specialized tools
Learn more about Postman:
Outras ferramentas de monitorização de APIs
Segue-se uma lista de ferramentas adicionais de monitorização de APIs que incluí na lista restrita, mas que não chegaram às 10 principais. Vale definitivamente a pena analisá-las.
- 11CatchpointBest for application experience insights
- 12MoesifBest for behavior analytics on API usage
- 13AsteraBest for holistic API management and integration
- 14APImetricsBest for comprehensive API performance insights
- 15UptrendsBest for global perspective with multiple checkpoint locations
- 16Dotcom MonitorBest for multi-step API monitoring
- 17AppDynamicsGood for deep dive diagnostics in real-time
- 18New RelicGood for application health visualizations
- 19SplunkGood for extensive log analysis capabilities
- 20SensuGood for event monitoring in dynamic environments
- 21Ghost InspectorGood for automated UI testing and monitoring
- 22Grafana CloudGood for customizable monitoring dashboards
- 23OpenNMSGood for network fault and performance management
- 24ApicaGood for large-scale load testing scenarios
- 253ScaleGood for API traffic control and security
- 26RunscopeGood for API data validation tests
- 27Rapid APIGood for vast API marketplace connections
- 28LoadViewGood for dynamic API load testing
- 29StatusCake APIGood for comprehensive uptime checks
- 30APIMaticGood for SDK generation from API definitions
How I Evaluate API Monitoring Tools
I split my evaluation into two layers: baseline capabilities every tool must cover—like multi-region checks, latency tracking, and assertions—and the differentiators that set the best options apart.
Core Functionality (Table Stakes For This List)
When I'm selecting tools for my list, I rank each one on a scale from 0 (does not offer the functionality) to 5 (excels in this area) for each core functionality listed below. Then, I calculate the tool's total score into a percentage. Each tool needs to achieve a minimum total score of 65% to be considered for inclusion.
- Uptime & Availability Monitoring: I check whether the tool runs HTTP/HTTPS checks from multiple global regions, since a single checkpoint won't catch regional outages or CDN failures.
- Performance & Latency Tracking: Beyond raw response times, I look for waterfall breakdowns (DNS, TLS, TTFB) and historical trend data that help you spot slow degradation before users notice.
- Synthetic API Testing: I evaluate support for all standard HTTP methods, custom headers, authentication flows, and scheduled intervals—think OAuth token refreshes or POST calls with dynamic payloads.
- Multi-Step Workflow Monitoring: Chaining requests matters. I look for the ability to pass variables between steps, like extracting a session token from a login call and injecting it into subsequent requests.
- Alerting & Notifications: I consider channel variety (email, Slack, SMS, PagerDuty, webhooks) and whether the tool supports escalation policies so the right on-call engineer gets paged first.
- Response Validation & Assertions: I look for assertion depth—status codes are table stakes, but JSON path matching, regex checks, and schema validation catch the subtle payload issues that break integrations.
Once I have a list of tools that meet this criteria, I consider what sets each platform apart.
Differentiating Factors (What Sets Vendors Apart)
Here's how I compare and contrast different vendors:
Standout Features
Tools that can import OpenAPI specs or Postman collections save hours of manual monitor setup, especially when you're covering dozens of endpoints. I also look for native CI/CD plugins—running API checks inside a GitHub Actions or GitLab pipeline means you catch breaking changes before they hit production. Distributed tracing integration is another differentiator worth evaluating, since linking a failed monitor to a specific trace across microservices turns a vague alert into an actionable root cause.
Beyond Features
Deployment flexibility matters—if your team monitors internal APIs behind a firewall, you need private agent support, not just cloud-hosted checks. I also evaluate how well each tool fits into existing observability stacks, checking for native integrations with platforms like Datadog, Grafana, and PagerDuty. Security posture is another factor I consider, especially RBAC, encrypted credential storage, and SOC 2 compliance, since API monitors often handle production tokens and sensitive auth flows.
Como escolher ferramentas de monitorização de APIs
É fácil perder-se em listas extensas de funcionalidades e estruturas de preços complexas. Para o ajudar a manter o foco enquanto realiza o seu processo específico de seleção de software, segue-se uma lista de verificação dos fatores a ter em conta:
| Fator | O que considerar |
|---|---|
| FatorEscalabilidade | O que considerarA ferramenta consegue lidar com o crescimento previsto do número de chamadas à API e de utilizadores? Procure uma arquitetura escalável para evitar estrangulamentos à medida que as suas necessidades aumentam. |
| FatorIntegrações | O que considerarIntegra-se facilmente com os seus sistemas existentes, como pipelines de CI/CD ou ferramentas de alertas? Verifique a compatibilidade com a sua pilha tecnológica. |
| FatorPersonalização | O que considerarPode adaptar a ferramenta às necessidades ou aos fluxos de trabalho específicos de monitorização? Procure painéis e alertas personalizáveis que correspondam aos seus requisitos. |
| FatorFacilidade de utilização | O que considerarA interface é intuitiva para a sua equipa? Uma curva de aprendizagem acentuada pode atrasar a adoção, por isso dê prioridade a um design intuitivo e a uma navegação clara. |
| FatorImplementação e integração inicial | O que considerarCom que rapidez pode a sua equipa começar a utilizar a ferramenta? Tenha em conta a disponibilidade de recursos de formação e de apoio durante a fase de configuração. |
| FatorCusto | O que considerarO preço está dentro do seu orçamento? Compare os planos de subscrição e verifique se existem taxas ocultas. Procure testes gratuitos para experimentar antes de se comprometer. |
| FatorMedidas de segurança | O que considerarOferece encriptação e conformidade com as normas de segurança? Certifique-se de que a ferramenta protege os dados sensíveis e cumpre os seus requisitos de segurança. |
O que são ferramentas de monitorização de APIs?
As ferramentas de monitorização de APIs são soluções de software que acompanham o desempenho, a disponibilidade e o estado das APIs. São utilizadas por programadores, engenheiros de DevOps e equipas de QA para garantir que as APIs funcionam conforme esperado e detetar problemas antes de os utilizadores se aperceberem deles.
As funcionalidades de alertas, registos e relatórios ajudam a detetar períodos de inatividade, a investigar respostas lentas e a confirmar o cumprimento dos SLA. Estas ferramentas facilitam a manutenção de serviços fiáveis e ajudam a evitar problemas que prejudicam a experiência do utilizador.
Funcionalidades
Ao selecionar ferramentas de monitorização de APIs, procure as seguintes funcionalidades essenciais:
- Monitorização da disponibilidade: Acompanha a disponibilidade das APIs para garantir que estão acessíveis e a funcionar corretamente.
- Acompanhamento do tempo de resposta: Mede a rapidez com que as APIs respondem aos pedidos, ajudando a identificar estrangulamentos de desempenho.
- Notificações de alerta: Envia alertas quando são detetados problemas, permitindo uma resposta imediata a potenciais dificuldades.
- Painéis personalizáveis: Disponibiliza vistas adaptadas das métricas de desempenho das APIs para responder a necessidades específicas de monitorização.
- Capacidades de integração: Liga-se facilmente a sistemas existentes, como pipelines de CI/CD e ferramentas de alertas, para uma integração harmoniosa com os fluxos de trabalho.
- Conformidade com requisitos de segurança: Garante a proteção dos dados através do cumprimento das normas de segurança do setor e dos protocolos de encriptação.
- Análise em tempo real: Oferece informações imediatas sobre o desempenho das APIs, permitindo uma gestão proativa do desempenho.
- Testes em várias regiões: Simula pedidos de API a partir de diferentes localizações para avaliar o desempenho e a latência globais.
- Informações baseadas em IA: Utiliza inteligência artificial para detetar anomalias e prever potenciais problemas antes de estes ocorrerem.
Benefícios
A implementação de ferramentas de monitorização de APIs proporciona vários benefícios à sua equipa e à sua empresa. Eis alguns dos benefícios que pode esperar:
- Maior fiabilidade: Ao monitorizar a disponibilidade, estas ferramentas ajudam a garantir que as APIs estão sempre acessíveis e são fiáveis.
- Resolução mais rápida de problemas: As notificações de alerta permitem à sua equipa resolver rapidamente os problemas, minimizando os períodos de inatividade e as interrupções do serviço.
- Desempenho melhorado: O acompanhamento do tempo de resposta ajuda a identificar e corrigir estrangulamentos de desempenho, garantindo operações eficientes das APIs.
- Tomada de decisões informada: A análise em tempo real fornece informações sobre a utilização e o desempenho das APIs, apoiando decisões baseadas em dados.
- Maior segurança: O cumprimento das normas de segurança ajuda a proteger dados sensíveis e a manter a confiança dos utilizadores.
- Avaliação do alcance global: Os testes em várias regiões permitem à sua equipa avaliar o desempenho das APIs em diferentes localizações geográficas.
- Gestão proativa: As informações baseadas em IA ajudam a prever e resolver potenciais problemas antes de estes afetarem os utilizadores.
Custos e preços
A seleção de ferramentas de monitorização de APIs requer uma compreensão dos vários modelos de preços e planos disponíveis. Os custos variam consoante as funcionalidades, a dimensão da equipa, os complementos e outros fatores. A tabela abaixo resume os planos comuns, os respetivos preços médios e as funcionalidades normalmente incluídas nas soluções de ferramentas de monitorização de APIs:
Tabela de comparação de planos para ferramentas de monitorização de APIs
| Tipo de plano | Preço médio | Funcionalidades comuns |
|---|---|---|
| Tipo de planoPlano gratuito | Preço médio$0 | Funcionalidades comunsMonitorização básica da disponibilidade, notificações de alerta limitadas e análise básica. |
| Tipo de planoPlano pessoal | Preço médio$5-$25/user/month | Funcionalidades comunsAcompanhamento da disponibilidade e do tempo de resposta, painéis personalizáveis e alertas por e-mail. |
| Tipo de planoPlano empresarial | Preço médio$50-$150/user/month | Funcionalidades comunsTestes em várias regiões, capacidades de integração, análise em tempo real e alertas avançados. |
| Tipo de planoPlano empresarial avançado | Preço médio$200+/user/month | Funcionalidades comunsInformações baseadas em IA, conformidade avançada com requisitos de segurança, suporte dedicado e personalização completa. |
Perguntas frequentes sobre ferramentas de monitorização de APIs
Aqui estão algumas respostas a perguntas comuns sobre ferramentas de monitorização de APIs:
Como monitoriza a utilização da API?
A utilização da API é normalmente monitorizada através do acompanhamento do tempo de atividade, medido como uma percentagem do tempo em que a API está disponível. A maioria visa um tempo de atividade de 99.9% ou superior. As ferramentas de monitorização podem alertá-lo para qualquer período de inatividade, ajudando-o a resolver rapidamente os problemas.
Que aspetos de uma API devem ser monitorizados?
Os principais aspetos a monitorizar incluem a gestão do controlo de acesso, os serviços de segurança e a segurança da firewall da rede. As ferramentas devem também acompanhar a orquestração de SSL/TLS e disponibilizar funcionalidades de gestão unificada para garantir uma supervisão abrangente do desempenho e da segurança da sua API.
Com que frequência deve testar as suas APIs?
Os testes regulares são cruciais, sendo que muitas ferramentas disponibilizam verificações minuto a minuto. Os testes frequentes ajudam a detetar problemas atempadamente e a manter a fiabilidade. Considere configurar o seu sistema de monitorização para testar cada API, pelo menos, a cada poucos minutos, de modo a garantir um desempenho consistente.
Porque são importantes as notificações de alerta na monitorização de APIs?
As notificações de alerta são essenciais porque o informam imediatamente de quaisquer problemas, permitindo uma resolução rápida. Sem alertas atempados, os problemas podem passar despercebidos, levando a períodos de inatividade prolongados e podendo afetar a experiência do utilizador.
Porque variam tanto os preços entre diferentes ferramentas?
O custo de uma ferramenta de monitorização de APIs é influenciado por vários fatores: a profundidade e a amplitude das funcionalidades, o público-alvo, a escalabilidade, a reputação da marca e o nível de apoio ao cliente disponibilizado.