

Grafanan arvostelu: hyvät ja huonot puolet, ominaisuudet ja hinnoittelu
Grafana erottuu edukseen joustavuutensa ja laajan lisäosien ekosysteeminsä ansiosta tarjoten tiimillesi vertaansa vailla olevat mukautusmahdollisuudet havainnointiratkaisuissa.

We review tools independently, and commissions help fund our testing. See our transparency policy, our methodology, or suggest a tool.
Grafana is an observability platform for teams that need to visualize and correlate metrics, logs, and traces across distributed infrastructure. I'd consider it if you want more flexibility and control over your monitoring stack than Datadog offers—particularly if you're already working with open-source tools like Prometheus or Loki and don't want to be locked into a single vendor's ecosystem.
Grafana Evaluation Summary
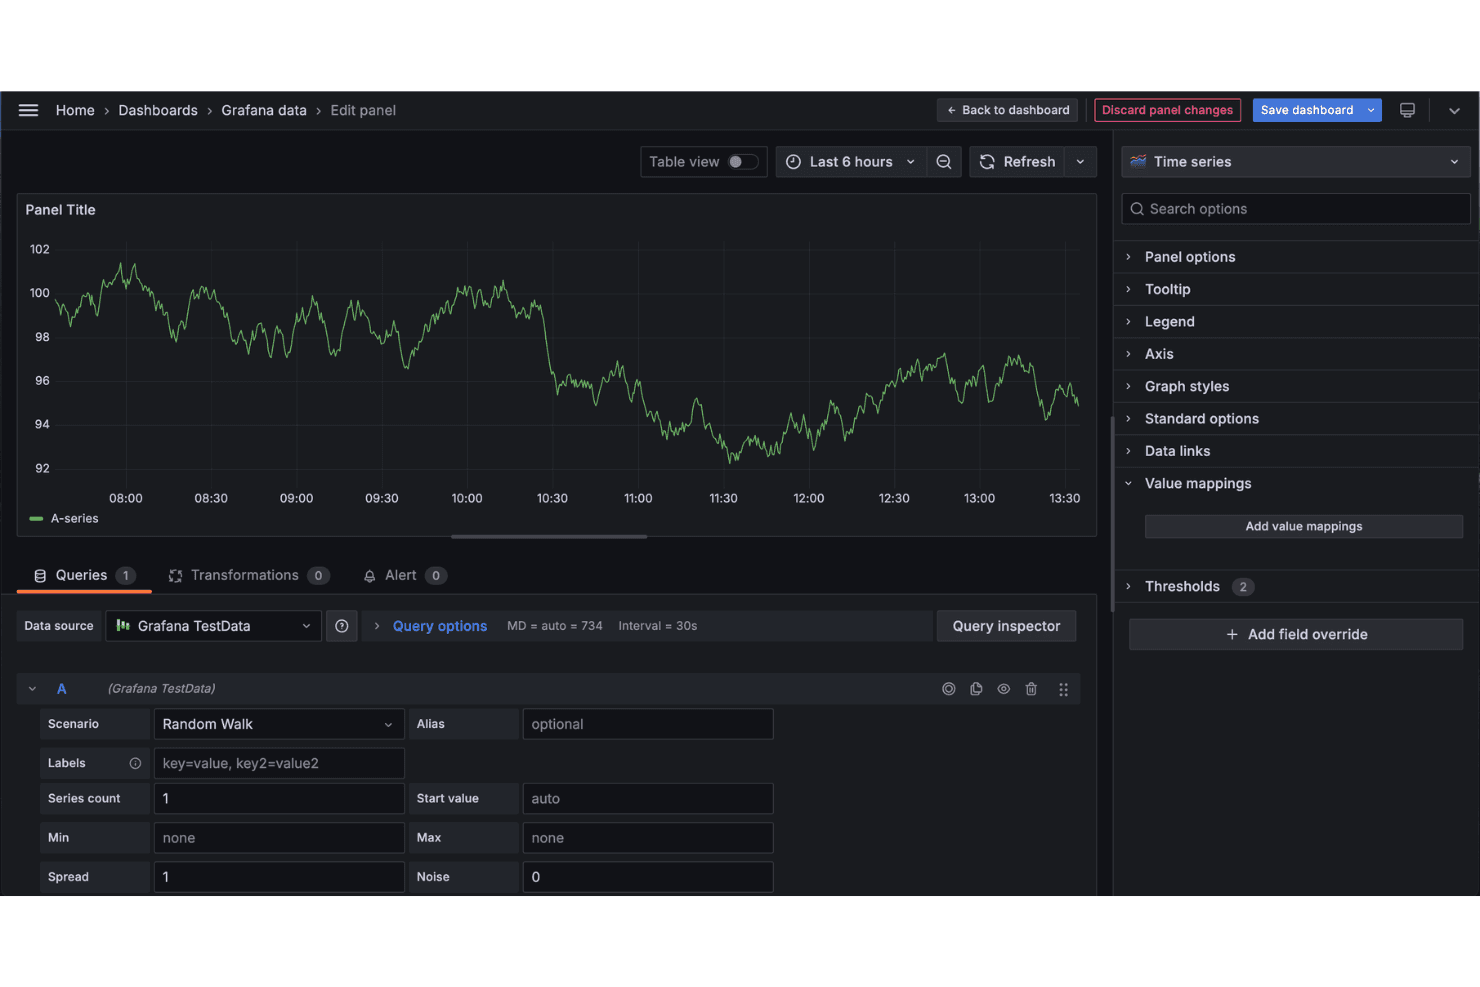
4.6/5
- From $19/month + usage
- Free plan + free trial available
Why Trust Our Software Recommendations
6,700+
Reviews
20
Industry experts
16+
Evaluation factors
14
Years
Our team has been testing and reviewing software since 2012. As tech leaders ourselves, we know how difficult—and important—it is to choose the right software.
For this guide, we evaluated tools using hands-on testing and independent research, scoring tools using our selection criteria.
Our reviews reflect our human editorial judgment, not a sales pitch.
Expert reviewers:
- Paulo Gardini MiguelTech Director
 Tim FisherVP of AI
 Gabriel RosasTech Lead & Software Architect
 Christhian GruhnTech Lead & Platform Architect

Grafana Overview
In my opinion, Grafana excels as an observability platform due to its extensive customization options and robust plugin ecosystem. While its onboarding and customer support could be more user-friendly, the platform offers great value for teams needing flexible data visualization. As a monitoring tool, Grafana outshines competitors in its ability to integrate with various data sources, making it ideal for IT departments and DevOps teams looking for detailed insights. However, it may not be the best fit for organizations that prioritize ease of use and immediate support. If your team values adaptability over simplicity, Grafana is worth considering.
Pros
- You can customize Grafana dashboards for your specific needs.
- The platform supports a wide range of data sources.
- Grafana provides a strong community and an extensive plugin ecosystem.
Cons
- Onboarding can be complex and time-consuming for new users.
- Customer support may not be as responsive as you'd hope.
- The interface could be more intuitive.
Is Grafana Right For Your Needs?
Who Would be a Good Fit for Grafana?
Grafana is a great tool for IT departments and DevOps teams that need detailed data visualization and customization. Its extensive plugin ecosystem supports the need for multiple data sources and flexible dashboards. Industries such as finance and healthcare, which work with a lot of data, can benefit from Grafana's ability to integrate and visualize complex datasets. This software suits users who value adaptability over simplicity, making it a strong choice for tech-savvy teams comfortable with a bit of a learning curve.
- IT DepartmentsGrafana supports IT teams with customizable dashboards that track system performance and metrics effectively.
- DevOps TeamsYour DevOps team can benefit from Grafana's real-time data visualization for monitoring infrastructure and applications.
- Finance IndustryGrafana excels in handling complex datasets, suitable for financial analysts who need detailed insights.
- Healthcare SectorHealthcare providers can utilize Grafana's data source integration to visualize patient and operational data seamlessly.
- Large EnterprisesLarge companies with diverse data sources may find Grafana's flexibility and plugin options invaluable for comprehensive data analysis.
- Tech StartupsInnovative startups will appreciate Grafana’s open-source nature and adaptability for rapid development and scaling needs.
Who Would be a Bad Fit for Grafana?
Grafana may not suit small businesses or teams with limited technical expertise. If your team needs a straightforward solution with minimal setup, Grafana's complexity and initial learning curve can be a barrier. Organizations that prioritize immediate customer support may find Grafana's support lacking. Additionally, teams without diverse data sources may find its extensive integration capabilities unnecessary.
- Small BusinessesSmall businesses may struggle with Grafana's complexity and prefer simpler, more intuitive tools.
- Non-Technical TeamsIf your team lacks technical skills, Grafana's setup and customization can be overwhelming.
- Retail IndustryRetail businesses with straightforward data needs may find Grafana's capabilities excessive.
- Customer Service DepartmentsCustomer service teams likely won't need the detailed data visualization Grafana offers.
- Education SectorSchools and educational institutions may not require Grafana's advanced features for their basic data needs.
- FreelancersFreelancers generally need quick, simple solutions, making Grafana's complexity unnecessary for their work.
Our Review Methodology
How We Test & Score Tools
We’ve spent years building, refining, and improving our software testing and scoring system. The rubric is designed to capture the nuances of software selection and what makes a tool effective, focusing on critical aspects of the decision-making process.
Below, you can see exactly how our testing and scoring works across seven criteria. It allows us to provide an unbiased evaluation of the software based on core functionality, standout features, ease of use, onboarding, customer support, integrations, customer reviews, and value for money.
Core Functionality (25% of final scoring)
The starting point of our evaluation is always the core functionality of the tool. Does it have the basic features and functions that a user would expect to see? Are any of those core features locked to higher-tiered pricing plans? At its core, we expect a tool to stand up against the baseline capabilities of its competitors.
Standout Features (25% of final scoring)
Next, we evaluate uncommon standout features that go above and beyond the core functionality typically found in tools of its kind. A high score reflects specialized or unique features that make the product faster, more efficient, or offer additional value to the user.
We also evaluate how easy it is to integrate with other tools typically found in the tech stack to expand the functionality and utility of the software. Tools offering plentiful native integrations, 3rd party connections, and API access to build custom integrations score best.
Ease of Use (10% of final scoring)
We consider how quick and easy it is to execute the tasks defined in the core functionality using the tool. High scoring software is well designed, intuitive to use, offers mobile apps, provides templates, and makes relatively complex tasks seem simple.
Onboarding (10% of final scoring)
We know how important rapid team adoption is for a new platform, so we evaluate how easy it is to learn and use a tool with minimal training. We evaluate how quickly a team member can get set up and start using the tool with no experience. High scoring solutions indicate little or no support is required.
Customer Support (10% of final scoring)
We review how quick and easy it is to get unstuck and find help by phone, live chat, or knowledge base. Tools and companies that provide real-time support score best, while chatbots score worst.
Customer Reviews (10% of final scoring)
Beyond our own testing and evaluation, we consider the net promoter score from current and past customers. We review their likelihood, given the option, to choose the tool again for the core functionality. A high scoring software reflects a high net promoter score from current or past customers.
Value for Money (10% of final scoring)
Lastly, in consideration of all the other criteria, we review the average price of entry level plans against the core features and consider the value of the other evaluation criteria. Software that delivers more, for less, will score higher.
Core Features
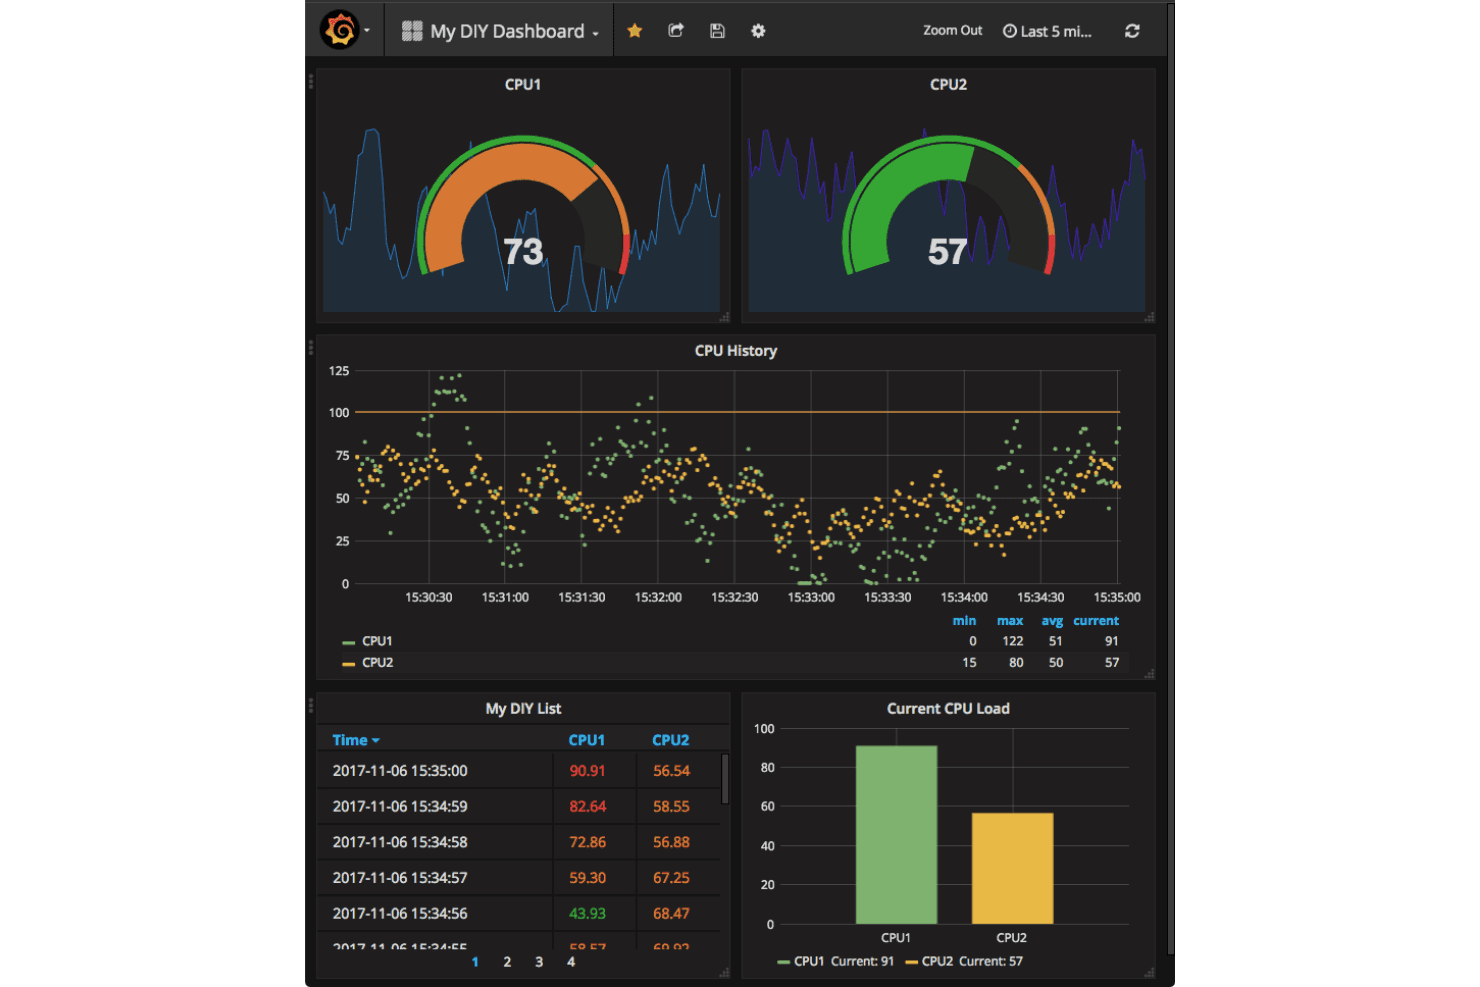
Dashboard Customization: You can create and personalize dashboards to fit your team's specific needs, making frontend data visualization intuitive. You can drag and drop widgets, adjust layouts, and apply themes to suit your preferences.
Alerting System: You can set up notifications to monitor critical metrics and alert your team about changes via email, Slack, or other channels, helping you stay proactive.
Data Source Support: You can connect to a wide range of data sources, allowing your team to visualize diverse datasets. Grafana supports databases such as Prometheus, InfluxDB, and Elasticsearch.
Annotations: You can add notes to your graphs to highlight significant events. Annotations appear as vertical lines on your charts, making it easy to correlate data points with real-world events.
Templating: You can use templates to create reusable dashboards, enhancing efficiency and consistency across your organization. This enables dynamic dashboard updates based on variables you define.
Time Series Analysis: Grafana's time series data capabilities let you analyze time-stamped telemetry data, enabling you to assess specific time frames and use queries to filter data.
Ease of Use
Grafana's can be challenging to use, especially for those unfamiliar with data visualization tools. While its interface is powerful, it requires time to master due to its complexity. It may take time for your team to learn how to fully utilize the platform, but once they do, Grafana's flexibility and customization options make it a valuable addition.

Integrations
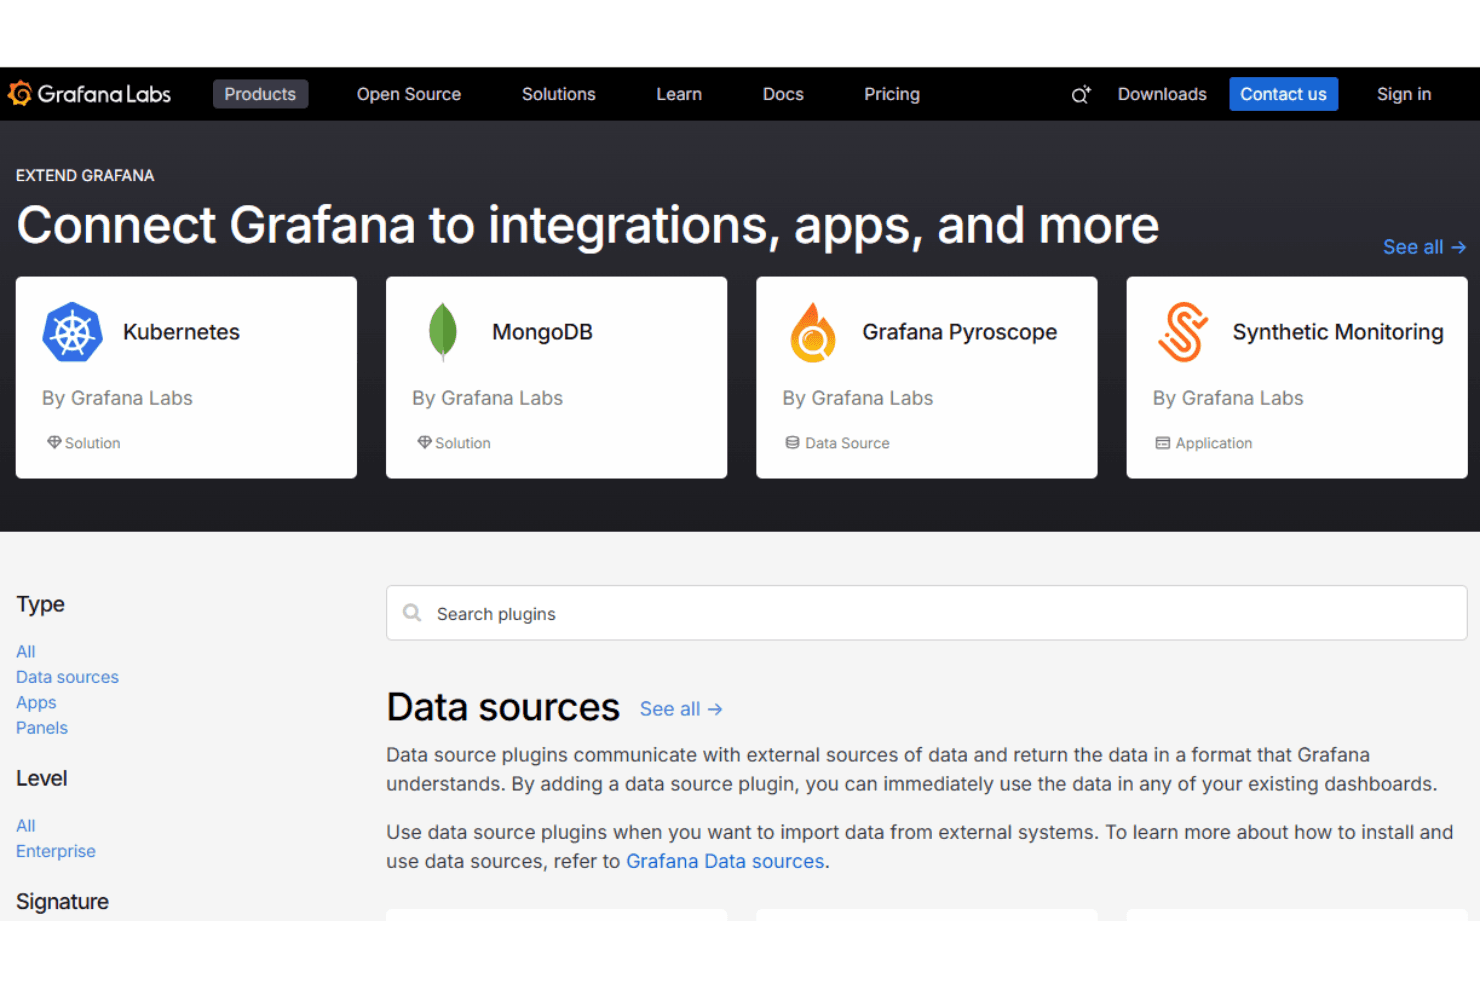
Grafana integrates with AWS, Prometheus, Elasticsearch, InfluxDB, Amazon CloudWatch, Azure Monitor, Google Cloud Monitoring, Loki, Jaeger, Alertmanager, and MySQL. The software also offers an API, is available for Linux, and can connect with third-party integration tools.
Grafana Specs
- API: Yes
- Bug Tracking: Yes
- CI/CD Integration: Yes
- Cloud Deployment: Yes
- Code Review: Yes
- Code Transformation: Yes
- Collaboration Support: Yes
- Data Export: Yes
- Data Import: Yes
- Developer Tools: Yes
- External Integrations: Yes
- Git Integration: Yes
- History/Version Control: Yes
- IDE Plugins: Yes
- Local Deployment: Yes
- Multi-User: Yes
- Notifications: Yes
- Project Management: Yes
- Release Management: Yes
- Static Analysis: Yes
- Task Scheduling/Tracking: Yes
- Testing: Yes


