

Recensione di Grafana: Vantaggi, Svantaggi, Funzionalità e Prezzi
Grafana si distingue per la sua flessibilità e l'ampio ecosistema di plugin, offrendo al tuo team una personalizzazione senza pari nelle soluzioni di osservabilità.

Recensiamo gli strumenti in modo indipendente e le commissioni ci aiutano a finanziare i nostri test. Consulta la nostra politica sulla trasparenza, la nostra metodologia, oppure suggerisci uno strumento.
Grafana is an observability platform for teams that need to visualize and correlate metrics, logs, and traces across distributed infrastructure. I'd consider it if you want more flexibility and control over your monitoring stack than Datadog offers—particularly if you're already working with open-source tools like Prometheus or Loki and don't want to be locked into a single vendor's ecosystem.
Grafana Evaluation Summary
4.6/5
- From $19/month + usage
- Free plan + free trial available
Perché fidarsi dei nostri consigli sui software
6,700+
Reviews
20
Industry experts
16+
Evaluation factors
14
Years
Il nostro team testa e recensisce software dal 2012. In quanto leader tecnologici noi stessi, sappiamo quanto sia difficile — e importante — scegliere il software giusto.
Per questa guida, abbiamo valutato gli strumenti attraverso test praticie ricerche indipendenti, assegnando un punteggio agli strumenti in base ai nostri criteri di selezione.
Le nostre recensioni riflettono il nostro giudizio editoriale umano, non un discorso di vendita.
Revisori esperti:
- Paulo Gardini MiguelDirettore tecnico
 Tim FisherVP dell'IA
 Gabriel RosasTech Lead e architetto software
 Christhian GruhnTech Lead e architetto della piattaforma

Grafana Overview
In my opinion, Grafana excels as an observability platform due to its extensive customization options and robust plugin ecosystem. While its onboarding and customer support could be more user-friendly, the platform offers great value for teams needing flexible data visualization. As a monitoring tool, Grafana outshines competitors in its ability to integrate with various data sources, making it ideal for IT departments and DevOps teams looking for detailed insights. However, it may not be the best fit for organizations that prioritize ease of use and immediate support. If your team values adaptability over simplicity, Grafana is worth considering.
Pros
- You can customize Grafana dashboards for your specific needs.
- The platform supports a wide range of data sources.
- Grafana provides a strong community and an extensive plugin ecosystem.
Cons
- Onboarding can be complex and time-consuming for new users.
- Customer support may not be as responsive as you'd hope.
- The interface could be more intuitive.
Is Grafana Right For Your Needs?
Who Would be a Good Fit for Grafana?
Grafana is a great tool for IT departments and DevOps teams that need detailed data visualization and customization. Its extensive plugin ecosystem supports the need for multiple data sources and flexible dashboards. Industries such as finance and healthcare, which work with a lot of data, can benefit from Grafana's ability to integrate and visualize complex datasets. This software suits users who value adaptability over simplicity, making it a strong choice for tech-savvy teams comfortable with a bit of a learning curve.
- IT DepartmentsGrafana supports IT teams with customizable dashboards that track system performance and metrics effectively.
- DevOps TeamsYour DevOps team can benefit from Grafana's real-time data visualization for monitoring infrastructure and applications.
- Finance IndustryGrafana excels in handling complex datasets, suitable for financial analysts who need detailed insights.
- Healthcare SectorHealthcare providers can utilize Grafana's data source integration to visualize patient and operational data seamlessly.
- Large EnterprisesLarge companies with diverse data sources may find Grafana's flexibility and plugin options invaluable for comprehensive data analysis.
- Tech StartupsInnovative startups will appreciate Grafana’s open-source nature and adaptability for rapid development and scaling needs.
Who Would be a Bad Fit for Grafana?
Grafana may not suit small businesses or teams with limited technical expertise. If your team needs a straightforward solution with minimal setup, Grafana's complexity and initial learning curve can be a barrier. Organizations that prioritize immediate customer support may find Grafana's support lacking. Additionally, teams without diverse data sources may find its extensive integration capabilities unnecessary.
- Small BusinessesSmall businesses may struggle with Grafana's complexity and prefer simpler, more intuitive tools.
- Non-Technical TeamsIf your team lacks technical skills, Grafana's setup and customization can be overwhelming.
- Retail IndustryRetail businesses with straightforward data needs may find Grafana's capabilities excessive.
- Customer Service DepartmentsCustomer service teams likely won't need the detailed data visualization Grafana offers.
- Education SectorSchools and educational institutions may not require Grafana's advanced features for their basic data needs.
- FreelancersFreelancers generally need quick, simple solutions, making Grafana's complexity unnecessary for their work.
La Nostra Metodologia di Recensione
Come Testiamo e Valutiamo gli Strumenti
Abbiamo trascorso anni a costruire, perfezionare e migliorare il nostro sistema di testing e valutazione del software. Il nostro schema è progettato per cogliere le sfumature della selezione software e cosa rende efficace uno strumento, focalizzandosi sugli aspetti critici del processo decisionale.
Di seguito, puoi vedere esattamente come funziona il nostro testing e punteggio su sette criteri. Ci permette di offrire una valutazione imparziale del software basata su funzionalità principali, caratteristiche distintive, facilità d’uso, onboarding, assistenza clienti, integrazioni, recensioni dei clienti e rapporto qualità-prezzo.
Funzionalità Principali (25% del punteggio finale)
Il punto di partenza della nostra valutazione è sempre la funzionalità principale dello strumento. Ha le funzioni e caratteristiche base che ci si aspetta? Alcune di queste caratteristiche sono limitate ai piani tariffari superiori? Fondamentalmente, ci aspettiamo che uno strumento regga il confronto rispetto alle capacità di base dei concorrenti.
Caratteristiche Distintive (25% del punteggio finale)
Successivamente, valutiamo le caratteristiche distintive e non comuni che vanno oltre la funzionalità base tipicamente trovata negli strumenti di questa categoria. Un punteggio alto riflette funzionalità specializzate o uniche che rendono il prodotto più veloce, efficiente o offrono ulteriore valore all’utente.
Valutiamo inoltre quanto sia semplice integrare altri strumenti tipicamente utilizzati nell’infrastruttura tecnologica per espandere la funzionalità e l’utilità del software. Gli strumenti che offrono numerose integrazioni native, connessioni di terze parti e accesso API per creare integrazioni personalizzate ottengono i punteggi migliori.
Facilità d’Uso (10% del punteggio finale)
Consideriamo quanto sia rapido e semplice svolgere i compiti definiti nella funzionalità principale utilizzando lo strumento. Il software con punteggio alto è ben progettato, intuitivo da usare, offre app mobili, fornisce modelli e rende semplici attività relativamente complesse.
Onboarding (10% del punteggio finale)
Sappiamo quanto sia importante l’adozione rapida da parte del team per una nuova piattaforma, quindi valutiamo quanto sia facile imparare e utilizzare uno strumento con formazione minima. Valutiamo quanto velocemente un membro del team possa iniziare a usare lo strumento anche senza esperienza. Soluzioni con punteggio alto indicano che sono richiesti pochi o nessun supporto.
Assistenza Clienti (10% del punteggio finale)
Esaminiamo quanto sia veloce e facile ricevere assistenza e risolvere problemi tramite telefono, live chat o knowledge base. Gli strumenti e le aziende che garantiscono supporto in tempo reale ottengono il miglior punteggio, mentre i chatbot ottengono il peggiore.
Recensioni dei Clienti (10% del punteggio finale)
Oltre ai nostri test e valutazioni, prendiamo in considerazione il net promoter score dei clienti attuali e passati. Valutiamo la probabilità che, data la scelta, selezionerebbero nuovamente lo strumento per la funzionalità principale. Un software con punteggio alto riflette un alto net promoter score da parte dei clienti attuali o passati.
Rapporto Qualità-Prezzo (10% del punteggio finale)
Infine, considerando tutti gli altri criteri, analizziamo il prezzo medio dei piani base rispetto alle funzionalità principali e consideriamo il valore degli altri criteri di valutazione. Il software che offre di più a meno otterrà un punteggio più alto.
Core Features
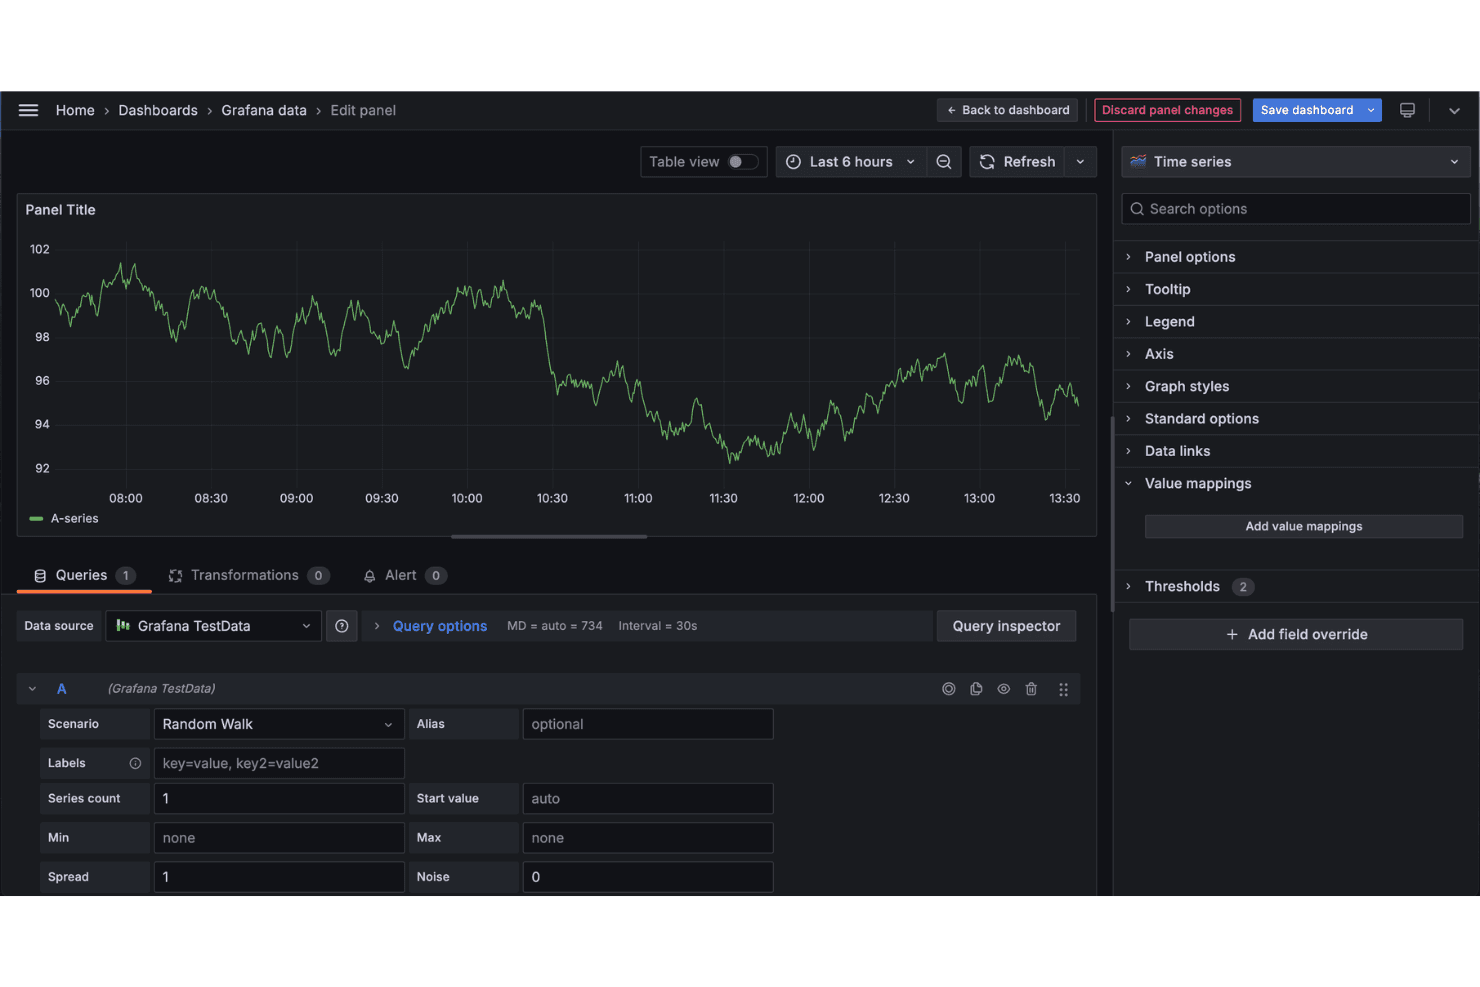
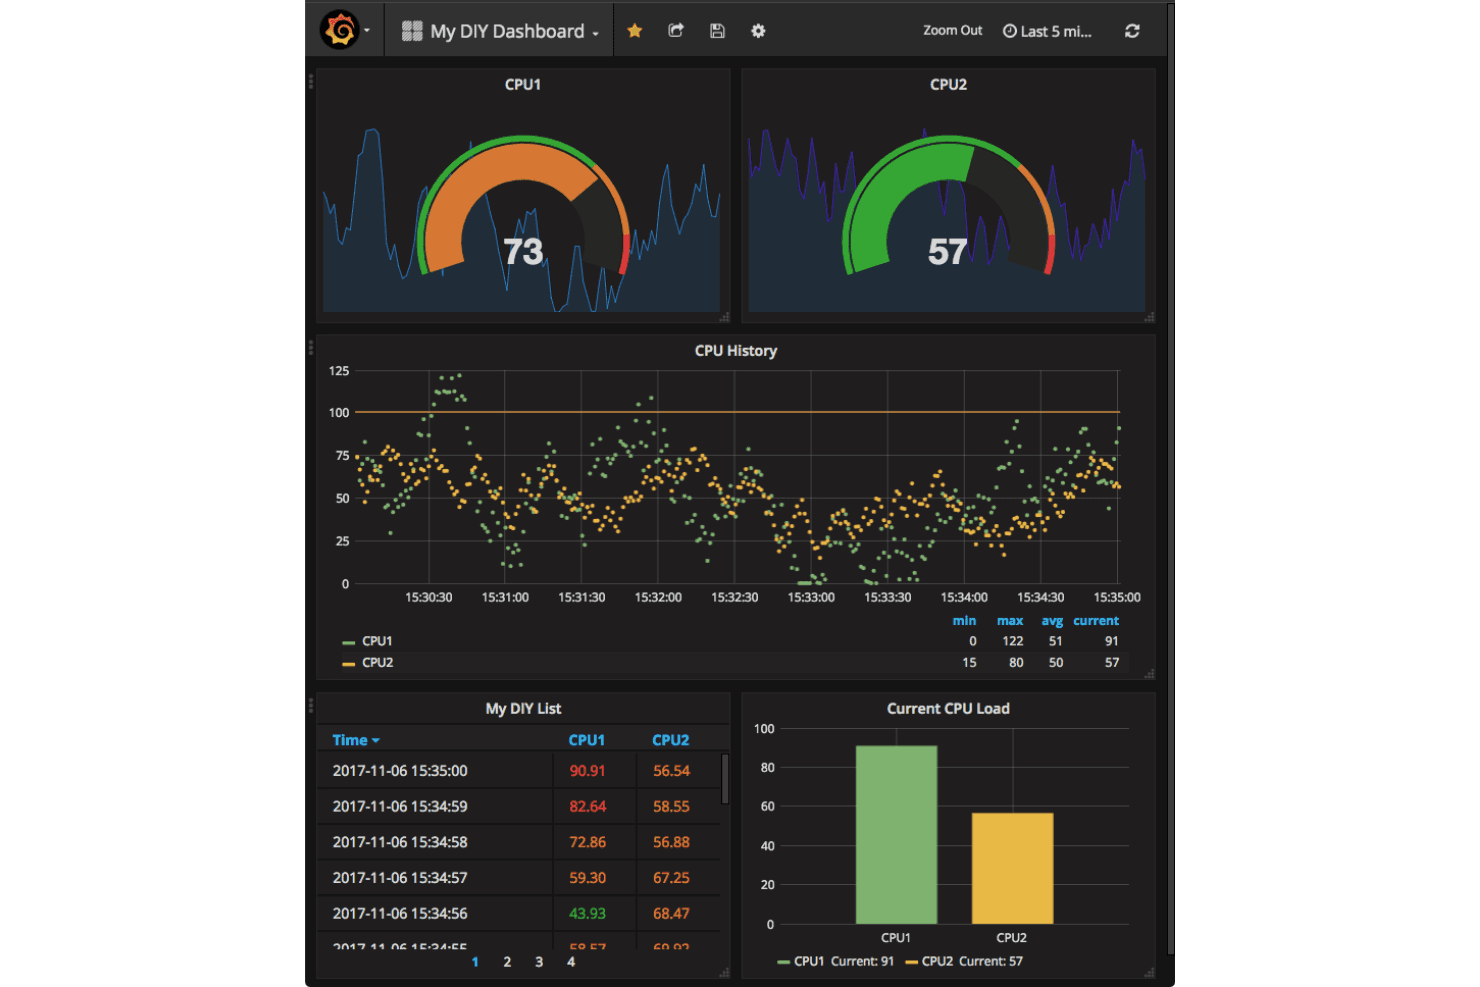
Dashboard Customization: You can create and personalize dashboards to fit your team's specific needs, making frontend data visualization intuitive. You can drag and drop widgets, adjust layouts, and apply themes to suit your preferences.
Alerting System: You can set up notifications to monitor critical metrics and alert your team about changes via email, Slack, or other channels, helping you stay proactive.
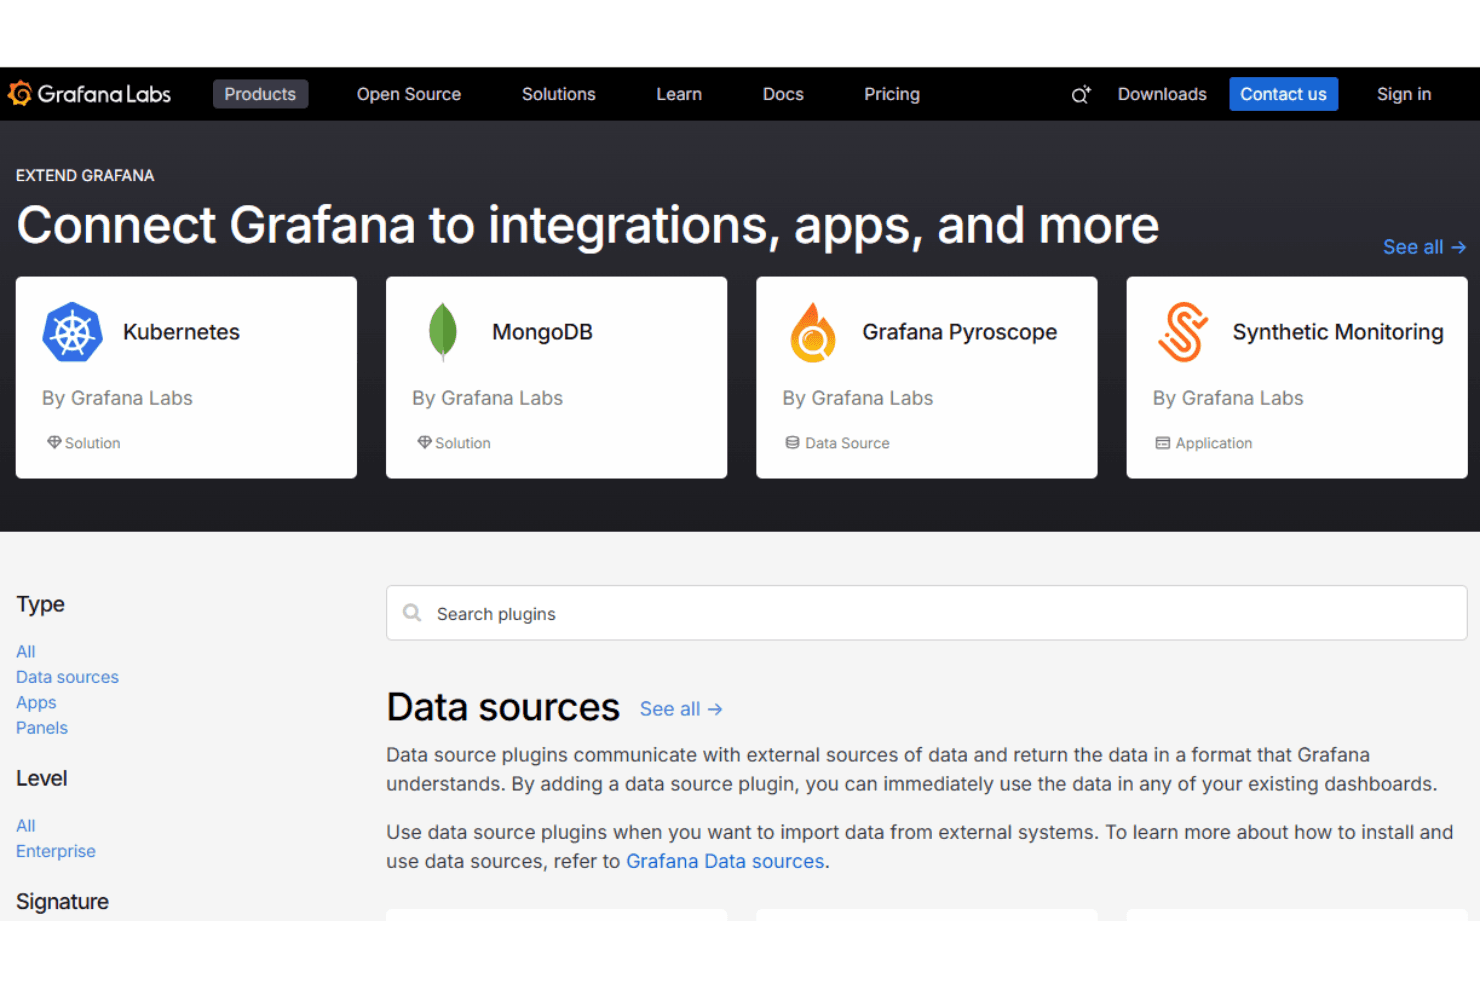
Data Source Support: You can connect to a wide range of data sources, allowing your team to visualize diverse datasets. Grafana supports databases such as Prometheus, InfluxDB, and Elasticsearch.
Annotations: You can add notes to your graphs to highlight significant events. Annotations appear as vertical lines on your charts, making it easy to correlate data points with real-world events.
Templating: You can use templates to create reusable dashboards, enhancing efficiency and consistency across your organization. This enables dynamic dashboard updates based on variables you define.
Time Series Analysis: Grafana's time series data capabilities let you analyze time-stamped telemetry data, enabling you to assess specific time frames and use queries to filter data.
Ease of Use
Grafana's can be challenging to use, especially for those unfamiliar with data visualization tools. While its interface is powerful, it requires time to master due to its complexity. It may take time for your team to learn how to fully utilize the platform, but once they do, Grafana's flexibility and customization options make it a valuable addition.

Integrations
Grafana integrates with AWS, Prometheus, Elasticsearch, InfluxDB, Amazon CloudWatch, Azure Monitor, Google Cloud Monitoring, Loki, Jaeger, Alertmanager, and MySQL. The software also offers an API, is available for Linux, and can connect with third-party integration tools.
Grafana Specs
- API: Yes
- Bug Tracking: Yes
- CI/CD Integration: Yes
- Cloud Deployment: Yes
- Code Review: Yes
- Code Transformation: Yes
- Collaboration Support: Yes
- Data Export: Yes
- Data Import: Yes
- Developer Tools: Yes
- External Integrations: Yes
- Git Integration: Yes
- History/Version Control: Yes
- IDE Plugins: Yes
- Local Deployment: Yes
- Multi-User: Yes
- Notifications: Yes
- Project Management: Yes
- Release Management: Yes
- Static Analysis: Yes
- Task Scheduling/Tracking: Yes
- Testing: Yes


