

Avis sur Grafana : Avantages, Inconvénients, Fonctionnalités et Tarification
Grafana se distingue par sa flexibilité et son vaste écosystème de plugins, offrant à votre équipe une personnalisation inégalée des solutions d'observabilité.

Nous évaluons les outils indépendamment ; les commissions aident à financer nos tests. Consultez notre politique de transparence et notre méthodologie.
Grafana is an observability platform for teams that need to visualize and correlate metrics, logs, and traces across distributed infrastructure. I'd consider it if you want more flexibility and control over your monitoring stack than Datadog offers—particularly if you're already working with open-source tools like Prometheus or Loki and don't want to be locked into a single vendor's ecosystem.
Grafana Evaluation Summary
4.6/5
- From $19/month + usage
- Free plan + free trial available
Pourquoi faire confiance à nos recommandations de logiciels
6,700+
Reviews
20
Industry experts
16+
Evaluation factors
14
Years
Notre équipe teste et évalue des logiciels depuis 2012. En tant que leaders technologiques nous-mêmes, nous savons à quel point il est difficile — et important — de choisir le bon logiciel.
Pour ce guide, nous avons évalué les outils grâce à des tests pratiques et une recherche indépendante, en notant les outils selon nos critères de sélection.
Nos avis reflètent notre jugement éditorial humain, et non un argumentaire de vente.
Réviseurs experts:
- Paulo Gardini MiguelDirecteur technique
 Tim FisherVP de l'IA
 Gabriel RosasTech Lead et architecte logiciel
 Christhian GruhnTech Lead et architecte plateforme

Grafana Overview
In my opinion, Grafana excels as an observability platform due to its extensive customization options and robust plugin ecosystem. While its onboarding and customer support could be more user-friendly, the platform offers great value for teams needing flexible data visualization. As a monitoring tool, Grafana outshines competitors in its ability to integrate with various data sources, making it ideal for IT departments and DevOps teams looking for detailed insights. However, it may not be the best fit for organizations that prioritize ease of use and immediate support. If your team values adaptability over simplicity, Grafana is worth considering.
Pros
- You can customize Grafana dashboards for your specific needs.
- The platform supports a wide range of data sources.
- Grafana provides a strong community and an extensive plugin ecosystem.
Cons
- Onboarding can be complex and time-consuming for new users.
- Customer support may not be as responsive as you'd hope.
- The interface could be more intuitive.
Is Grafana Right For Your Needs?
Who Would be a Good Fit for Grafana?
Grafana is a great tool for IT departments and DevOps teams that need detailed data visualization and customization. Its extensive plugin ecosystem supports the need for multiple data sources and flexible dashboards. Industries such as finance and healthcare, which work with a lot of data, can benefit from Grafana's ability to integrate and visualize complex datasets. This software suits users who value adaptability over simplicity, making it a strong choice for tech-savvy teams comfortable with a bit of a learning curve.
- IT DepartmentsGrafana supports IT teams with customizable dashboards that track system performance and metrics effectively.
- DevOps TeamsYour DevOps team can benefit from Grafana's real-time data visualization for monitoring infrastructure and applications.
- Finance IndustryGrafana excels in handling complex datasets, suitable for financial analysts who need detailed insights.
- Healthcare SectorHealthcare providers can utilize Grafana's data source integration to visualize patient and operational data seamlessly.
- Large EnterprisesLarge companies with diverse data sources may find Grafana's flexibility and plugin options invaluable for comprehensive data analysis.
- Tech StartupsInnovative startups will appreciate Grafana’s open-source nature and adaptability for rapid development and scaling needs.
Who Would be a Bad Fit for Grafana?
Grafana may not suit small businesses or teams with limited technical expertise. If your team needs a straightforward solution with minimal setup, Grafana's complexity and initial learning curve can be a barrier. Organizations that prioritize immediate customer support may find Grafana's support lacking. Additionally, teams without diverse data sources may find its extensive integration capabilities unnecessary.
- Small BusinessesSmall businesses may struggle with Grafana's complexity and prefer simpler, more intuitive tools.
- Non-Technical TeamsIf your team lacks technical skills, Grafana's setup and customization can be overwhelming.
- Retail IndustryRetail businesses with straightforward data needs may find Grafana's capabilities excessive.
- Customer Service DepartmentsCustomer service teams likely won't need the detailed data visualization Grafana offers.
- Education SectorSchools and educational institutions may not require Grafana's advanced features for their basic data needs.
- FreelancersFreelancers generally need quick, simple solutions, making Grafana's complexity unnecessary for their work.
Notre méthodologie d'évaluation
Comment nous testons et notons les outils
Nous avons passé des années à développer, affiner et améliorer notre système de test et de notation des logiciels. Cette grille d’évaluation est conçue pour saisir les subtilités de la sélection des logiciels et ce qui rend un outil efficace, en se concentrant sur les aspects critiques du processus de décision.
Vous trouverez ci-dessous le détail de notre processus de test et de notation sur sept critères. Cela nous permet de fournir une évaluation impartiale du logiciel basée sur les fonctionnalités principales, les caractéristiques distinctives, la facilité d’utilisation, l’intégration, l’accompagnement lors de la prise en main, le support client, les avis utilisateurs et le rapport qualité-prix.
Fonctionnalité principale (25% de la note finale)
Le point de départ de notre évaluation est toujours la fonctionnalité principale de l’outil. Possède-t-il les fonctions de base auxquelles un utilisateur s’attend ? Certaines de ces fonctionnalités principales sont-elles limitées à des forfaits plus chers ? Nous attendons d’un outil qu’il soit au moins à la hauteur des capacités de base de ses concurrents.
Fonctionnalités remarquables (25% de la note finale)
Ensuite, nous évaluons les fonctionnalités exceptionnelles qui dépassent la fonctionnalité de base habituellement trouvée dans ce type d’outil. Un score élevé reflète des fonctionnalités spécialisées ou uniques rendant le produit plus rapide, plus efficace ou apportant une valeur ajoutée à l’utilisateur.
Nous évaluons aussi la facilité d’intégration avec d’autres outils courants dans la pile technologique pour élargir les fonctionnalités et l’utilité du logiciel. Les outils dotés de nombreuses intégrations natives, de connexions tierces et d’un accès API facilitant des intégrations personnalisées obtiennent les meilleurs scores.
Facilité d’utilisation (10% de la note finale)
Nous considérons la rapidité et la simplicité d’exécution des tâches principales avec l’outil. Les logiciels les mieux notés sont bien conçus, intuitifs, proposent des applications mobiles, offrent des modèles et rendent des tâches relativement complexes très simples.
Accompagnement lors de la prise en main (10% de la note finale)
Nous savons que l’adoption rapide d’une nouvelle plateforme au sein d’une équipe est cruciale. Nous évaluons donc la facilité avec laquelle un nouvel utilisateur peut apprendre et utiliser un outil avec un minimum de formation. Les meilleures solutions permettent une mise en route rapide, sans nécessité de support.
Support client (10% de la note finale)
Nous analysons la facilité et la rapidité avec lesquelles il est possible d’obtenir de l’aide par téléphone, chat en direct ou base de connaissances. Les outils et entreprises offrant une assistance en temps réel obtiennent les meilleurs scores, tandis que les chatbots sont moins bien notés.
Avis utilisateurs (10% de la note finale)
Au-delà de nos propres tests et évaluations, nous tenons compte du net promoter score des utilisateurs actuels et passés. Nous regardons la probabilité qu’ils choisiraient à nouveau l’outil pour ses fonctionnalités principales. Un logiciel bien noté reflète un net promoter score élevé.
Rapport qualité-prix (10% de la note finale)
Enfin, en tenant compte de tous les autres critères, nous examinons le prix moyen des forfaits d’entrée de gamme par rapport aux fonctionnalités principales et à la valeur des autres critères. Un logiciel offrant plus, pour moins cher, obtiendra un meilleur score.
Core Features
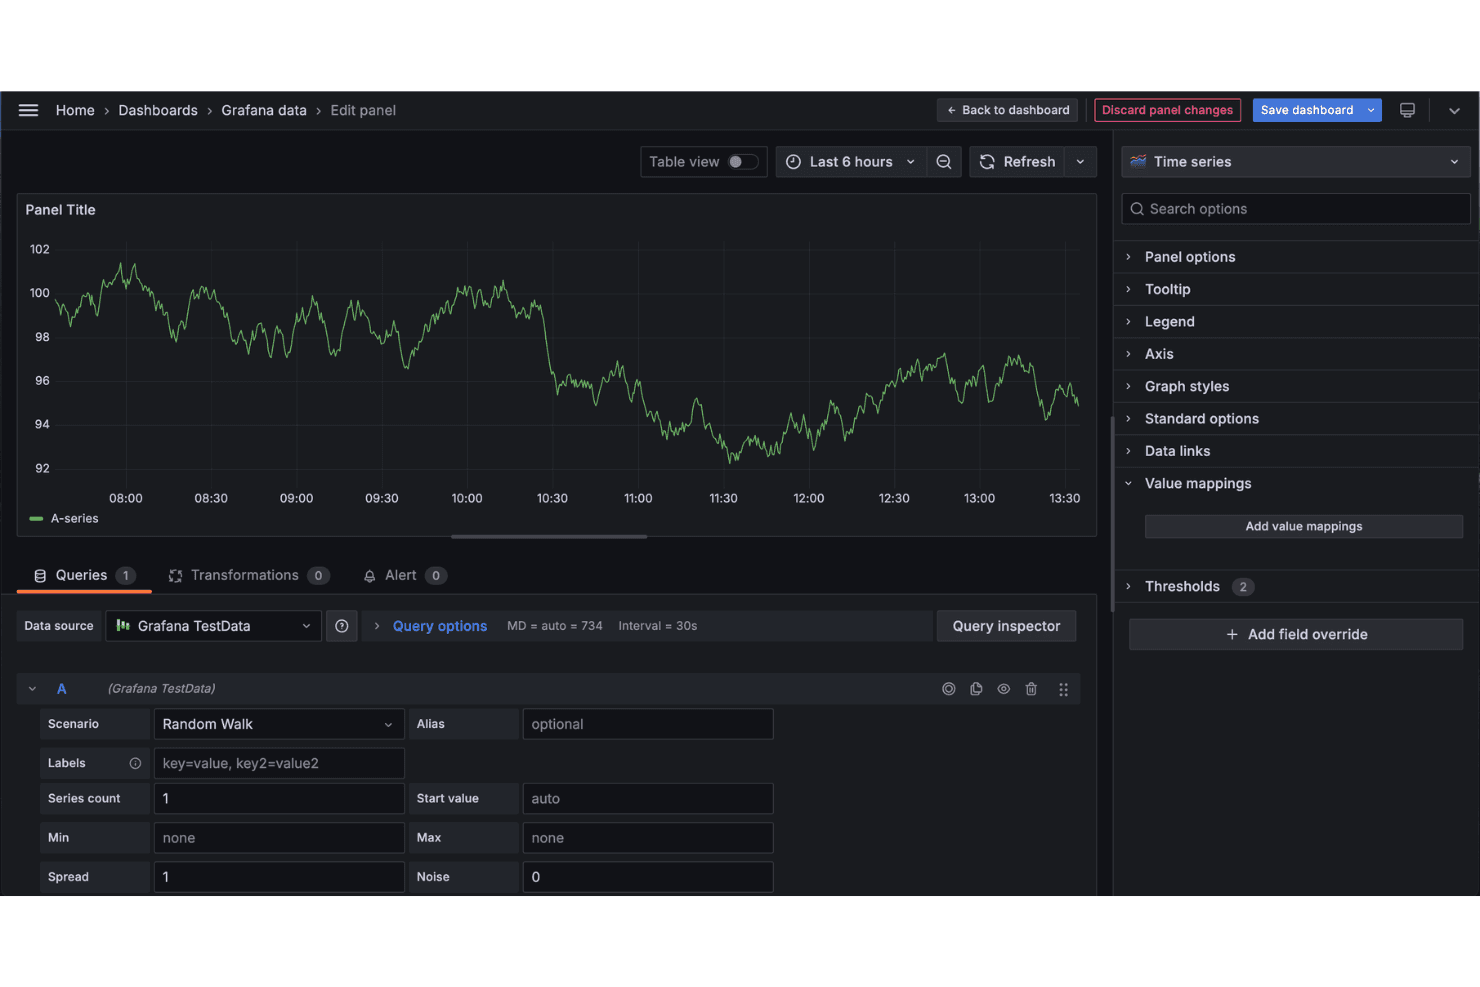
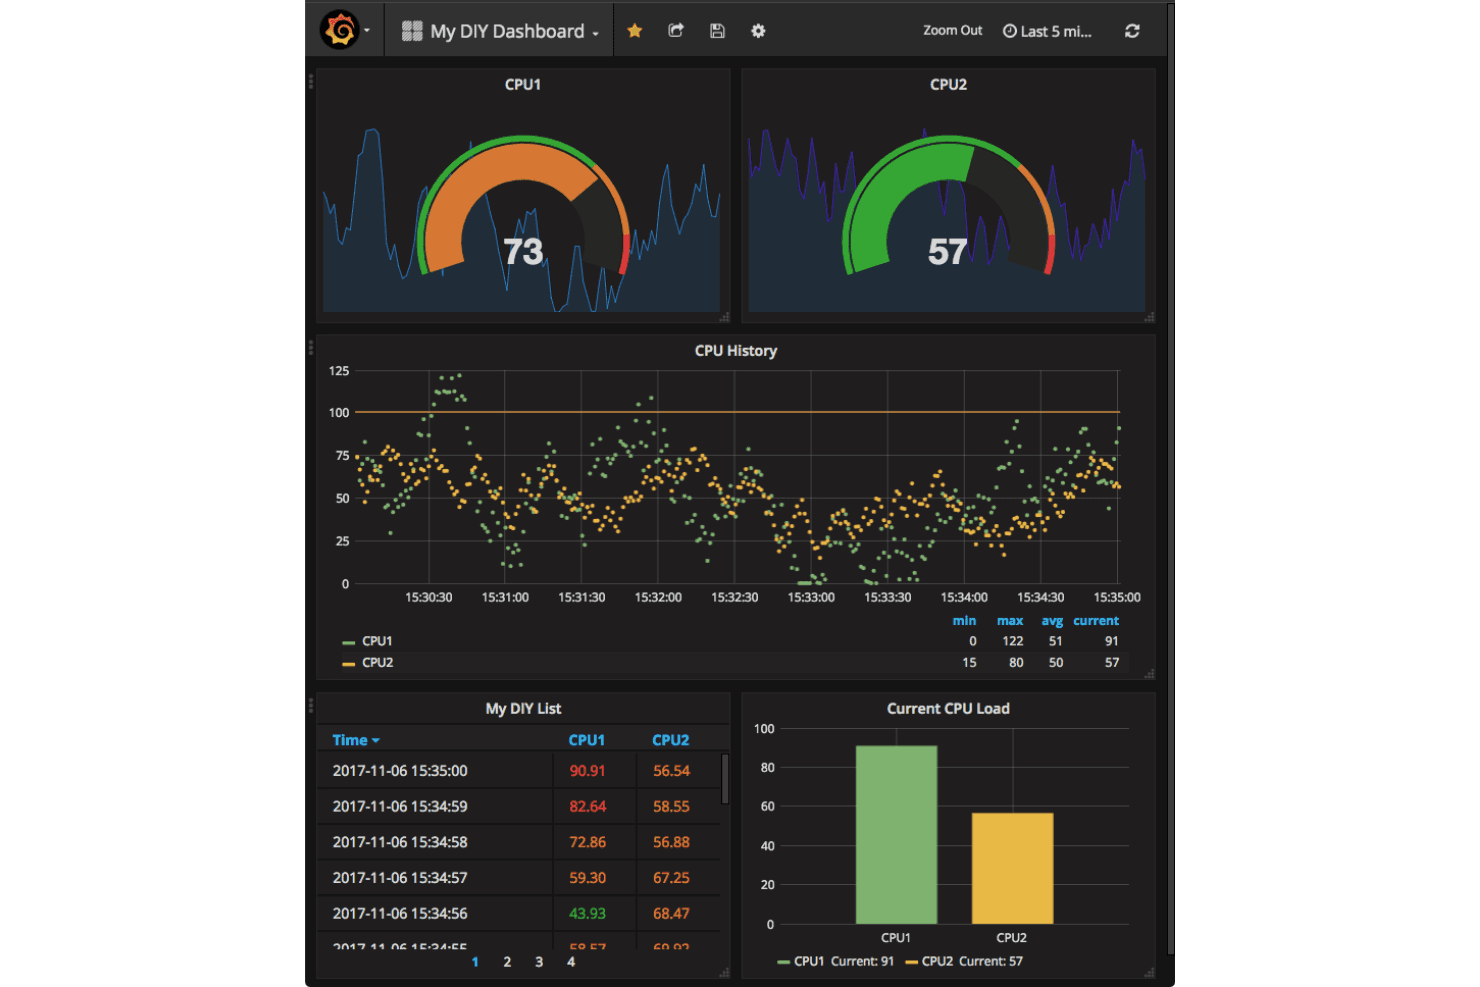
Dashboard Customization: You can create and personalize dashboards to fit your team's specific needs, making frontend data visualization intuitive. You can drag and drop widgets, adjust layouts, and apply themes to suit your preferences.
Alerting System: You can set up notifications to monitor critical metrics and alert your team about changes via email, Slack, or other channels, helping you stay proactive.
Data Source Support: You can connect to a wide range of data sources, allowing your team to visualize diverse datasets. Grafana supports databases such as Prometheus, InfluxDB, and Elasticsearch.
Annotations: You can add notes to your graphs to highlight significant events. Annotations appear as vertical lines on your charts, making it easy to correlate data points with real-world events.
Templating: You can use templates to create reusable dashboards, enhancing efficiency and consistency across your organization. This enables dynamic dashboard updates based on variables you define.
Time Series Analysis: Grafana's time series data capabilities let you analyze time-stamped telemetry data, enabling you to assess specific time frames and use queries to filter data.
Ease of Use
Grafana's can be challenging to use, especially for those unfamiliar with data visualization tools. While its interface is powerful, it requires time to master due to its complexity. It may take time for your team to learn how to fully utilize the platform, but once they do, Grafana's flexibility and customization options make it a valuable addition.

Integrations
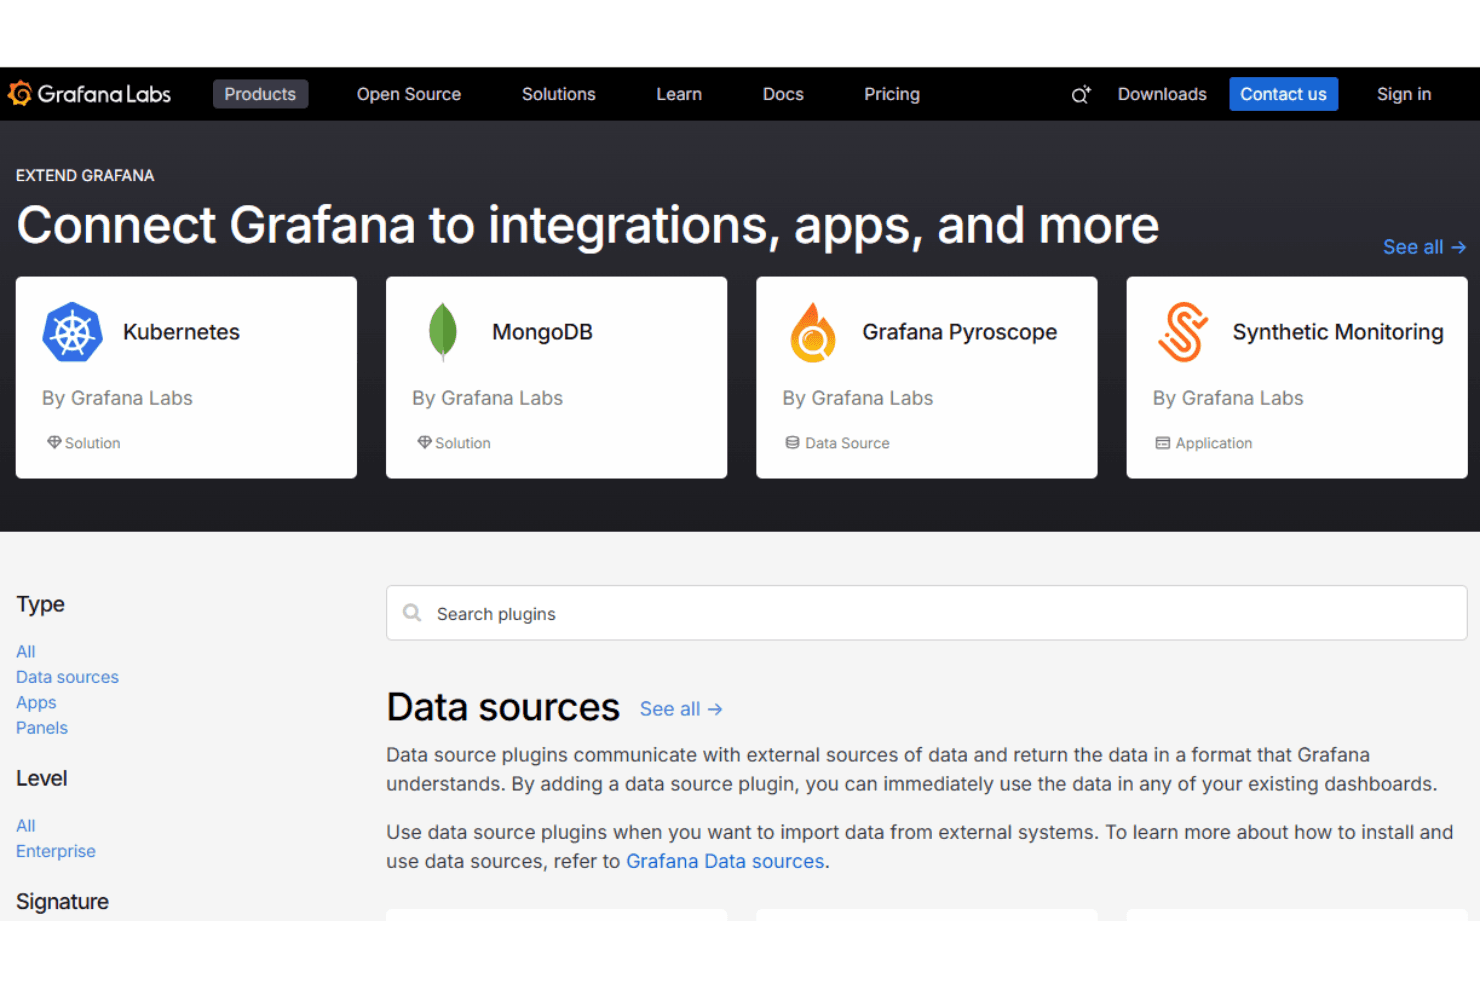
Grafana integrates with AWS, Prometheus, Elasticsearch, InfluxDB, Amazon CloudWatch, Azure Monitor, Google Cloud Monitoring, Loki, Jaeger, Alertmanager, and MySQL. The software also offers an API, is available for Linux, and can connect with third-party integration tools.
Grafana Specs
- API: Yes
- Bug Tracking: Yes
- CI/CD Integration: Yes
- Cloud Deployment: Yes
- Code Review: Yes
- Code Transformation: Yes
- Collaboration Support: Yes
- Data Export: Yes
- Data Import: Yes
- Developer Tools: Yes
- External Integrations: Yes
- Git Integration: Yes
- History/Version Control: Yes
- IDE Plugins: Yes
- Local Deployment: Yes
- Multi-User: Yes
- Notifications: Yes
- Project Management: Yes
- Release Management: Yes
- Static Analysis: Yes
- Task Scheduling/Tracking: Yes
- Testing: Yes


