

Grafana im Test: Vorteile, Nachteile, Funktionen und Preise
Grafana zeichnet sich durch seine Flexibilität und das umfangreiche Plugin-Ökosystem aus und bietet Ihrem Team unvergleichliche Anpassungsmöglichkeiten bei Observability-Lösungen.

Wir bewerten Tools unabhängig; Provisionen helfen, unsere Tests zu finanzieren. Siehe unsere Transparenzrichtlinie und unsere Methodik.
Grafana is an observability platform for teams that need to visualize and correlate metrics, logs, and traces across distributed infrastructure. I'd consider it if you want more flexibility and control over your monitoring stack than Datadog offers—particularly if you're already working with open-source tools like Prometheus or Loki and don't want to be locked into a single vendor's ecosystem.
Grafana Evaluation Summary
4.6/5
- From $19/month + usage
- Free plan + free trial available
Warum Sie unseren Software-Empfehlungen vertrauen können
6,700+
Reviews
20
Industry experts
16+
Evaluation factors
14
Years
Unser Team testet und bewertet Software seit 2012. Als Tech-Führungskräfte wissen wir selbst, wie schwierig – und wichtig – es ist, die richtige Software auszuwählen.
Für diesen Leitfaden haben wir Tools mithilfe von praktischen Tests und unabhängiger Recherche bewertet und dabei unsere Bewertungskriterien angewendet.
Unsere Bewertungen spiegeln unser menschliches redaktionelles Urteilsvermögen wider, keine Verkaufsstrategie.
Expertenprüfer:
- Paulo Gardini MiguelTech-Direktor
 Tim FisherVP für KI
 Gabriel RosasTech Lead & Software-Architekt
 Christhian GruhnTech Lead & Plattform-Architekt

Grafana Overview
In my opinion, Grafana excels as an observability platform due to its extensive customization options and robust plugin ecosystem. While its onboarding and customer support could be more user-friendly, the platform offers great value for teams needing flexible data visualization. As a monitoring tool, Grafana outshines competitors in its ability to integrate with various data sources, making it ideal for IT departments and DevOps teams looking for detailed insights. However, it may not be the best fit for organizations that prioritize ease of use and immediate support. If your team values adaptability over simplicity, Grafana is worth considering.
Pros
- You can customize Grafana dashboards for your specific needs.
- The platform supports a wide range of data sources.
- Grafana provides a strong community and an extensive plugin ecosystem.
Cons
- Onboarding can be complex and time-consuming for new users.
- Customer support may not be as responsive as you'd hope.
- The interface could be more intuitive.
Is Grafana Right For Your Needs?
Who Would be a Good Fit for Grafana?
Grafana is a great tool for IT departments and DevOps teams that need detailed data visualization and customization. Its extensive plugin ecosystem supports the need for multiple data sources and flexible dashboards. Industries such as finance and healthcare, which work with a lot of data, can benefit from Grafana's ability to integrate and visualize complex datasets. This software suits users who value adaptability over simplicity, making it a strong choice for tech-savvy teams comfortable with a bit of a learning curve.
- IT DepartmentsGrafana supports IT teams with customizable dashboards that track system performance and metrics effectively.
- DevOps TeamsYour DevOps team can benefit from Grafana's real-time data visualization for monitoring infrastructure and applications.
- Finance IndustryGrafana excels in handling complex datasets, suitable for financial analysts who need detailed insights.
- Healthcare SectorHealthcare providers can utilize Grafana's data source integration to visualize patient and operational data seamlessly.
- Large EnterprisesLarge companies with diverse data sources may find Grafana's flexibility and plugin options invaluable for comprehensive data analysis.
- Tech StartupsInnovative startups will appreciate Grafana’s open-source nature and adaptability for rapid development and scaling needs.
Who Would be a Bad Fit for Grafana?
Grafana may not suit small businesses or teams with limited technical expertise. If your team needs a straightforward solution with minimal setup, Grafana's complexity and initial learning curve can be a barrier. Organizations that prioritize immediate customer support may find Grafana's support lacking. Additionally, teams without diverse data sources may find its extensive integration capabilities unnecessary.
- Small BusinessesSmall businesses may struggle with Grafana's complexity and prefer simpler, more intuitive tools.
- Non-Technical TeamsIf your team lacks technical skills, Grafana's setup and customization can be overwhelming.
- Retail IndustryRetail businesses with straightforward data needs may find Grafana's capabilities excessive.
- Customer Service DepartmentsCustomer service teams likely won't need the detailed data visualization Grafana offers.
- Education SectorSchools and educational institutions may not require Grafana's advanced features for their basic data needs.
- FreelancersFreelancers generally need quick, simple solutions, making Grafana's complexity unnecessary for their work.
Unsere Bewertungsmethodik
Wie wir Werkzeuge testen & bewerten
Wir haben Jahre damit verbracht, unser System zur Softwareprüfung und -bewertung aufzubauen, zu verfeinern und zu verbessern. Das Bewertungsraster ist darauf ausgelegt, die Feinheiten der Softwareauswahl und Effektivität eines Tools einzufangen, wobei wir uns auf kritische Aspekte des Entscheidungsprozesses konzentrieren.
Nachfolgend sehen Sie genau, wie unser Test- und Bewertungssystem anhand von sieben Kriterien funktioniert. Es ermöglicht uns eine unparteiische Bewertung der Software basierend auf Grundfunktionalität, besonderen Funktionen, Benutzerfreundlichkeit, Onboarding, Kundensupport, Integrationen, Kundenbewertungen und Preis-Leistungs-Verhältnis.
Grundfunktionalität (25 % der Endbewertung)
Der Ausgangspunkt unserer Bewertung ist immer die Grundfunktionalität des Werkzeugs. Verfügt es über die grundlegenden Funktionen und Merkmale, die ein Benutzer erwarten würde? Sind grundlegende Funktionen auf höherpreisige Tarife beschränkt? Im Kern erwarten wir, dass ein Tool den Basisfähigkeiten seiner Konkurrenten standhält.
Besondere Features (25 % der Endbewertung)
Anschließend bewerten wir ungewöhnliche, herausragende Funktionen, die über die typische Grundfunktionalität von Tools dieser Art hinausgehen. Eine hohe Bewertung zeigt spezialisierte oder einzigartige Eigenschaften, die das Produkt schneller, effizienter oder für den Nutzer wertvoller machen.
Wir bewerten außerdem, wie einfach sich das Tool mit anderen üblichen Werkzeugen im Technologie-Stack integrieren lässt, um die Funktionalität und den Nutzen der Software zu erweitern. Tools mit vielen nativen Integrationen, Drittanbieter-Anbindungen und API-Zugang zur Erstellung kundenspezifischer Integrationen erhalten die besten Bewertungen.
Benutzerfreundlichkeit (10 % der Endbewertung)
Wir betrachten, wie schnell und einfach Aufgaben aus dem Bereich der Grundfunktionalität mit dem Tool erledigt werden können. Gut bewertete Software ist durchdacht gestaltet, intuitiv bedienbar, bietet mobile Apps, Vorlagen und lässt relativ komplexe Aufgaben einfach erscheinen.
Onboarding (10 % der Endbewertung)
Wir wissen, wie wichtig die schnelle Einführung eines neuen Tools für das Team ist, daher bewerten wir, wie leicht sich ein Werkzeug mit minimalem Training erlernen und nutzen lässt. Wir bewerten, wie schnell ein Teammitglied ohne Vorerfahrung anfangen kann. Hoch bewertete Lösungen benötigen wenig bis gar keine Unterstützung.
Kundensupport (10 % der Endbewertung)
Wir prüfen, wie schnell und einfach man bei Problemen Hilfe per Telefon, Live-Chat oder Wissensdatenbank erhält. Tools und Anbieter mit Echtzeit-Support werden besser bewertet, während Chatbots schlechter abschneiden.
Kundenbewertungen (10 % der Endbewertung)
Neben unserer eigenen Prüfung beziehen wir den Net Promoter Score aktueller und ehemaliger Kunden mit ein. Wir bewerten, wie wahrscheinlich es ist, dass sie sich erneut für das Werkzeug entscheiden würden. Hoch bewertete Software weist einen hohen Net Promoter Score auf.
Preis-Leistungs-Verhältnis (10 % der Endbewertung)
Abschließend vergleichen wir unter Berücksichtigung aller Kriterien den durchschnittlichen Preis der Einstiegspakete mit den Grundfunktionen und bewerten den Mehrwert aus den anderen Bewertungsbereichen. Software, die mehr fürs gleiche Geld bietet, schneidet besser ab.
Core Features
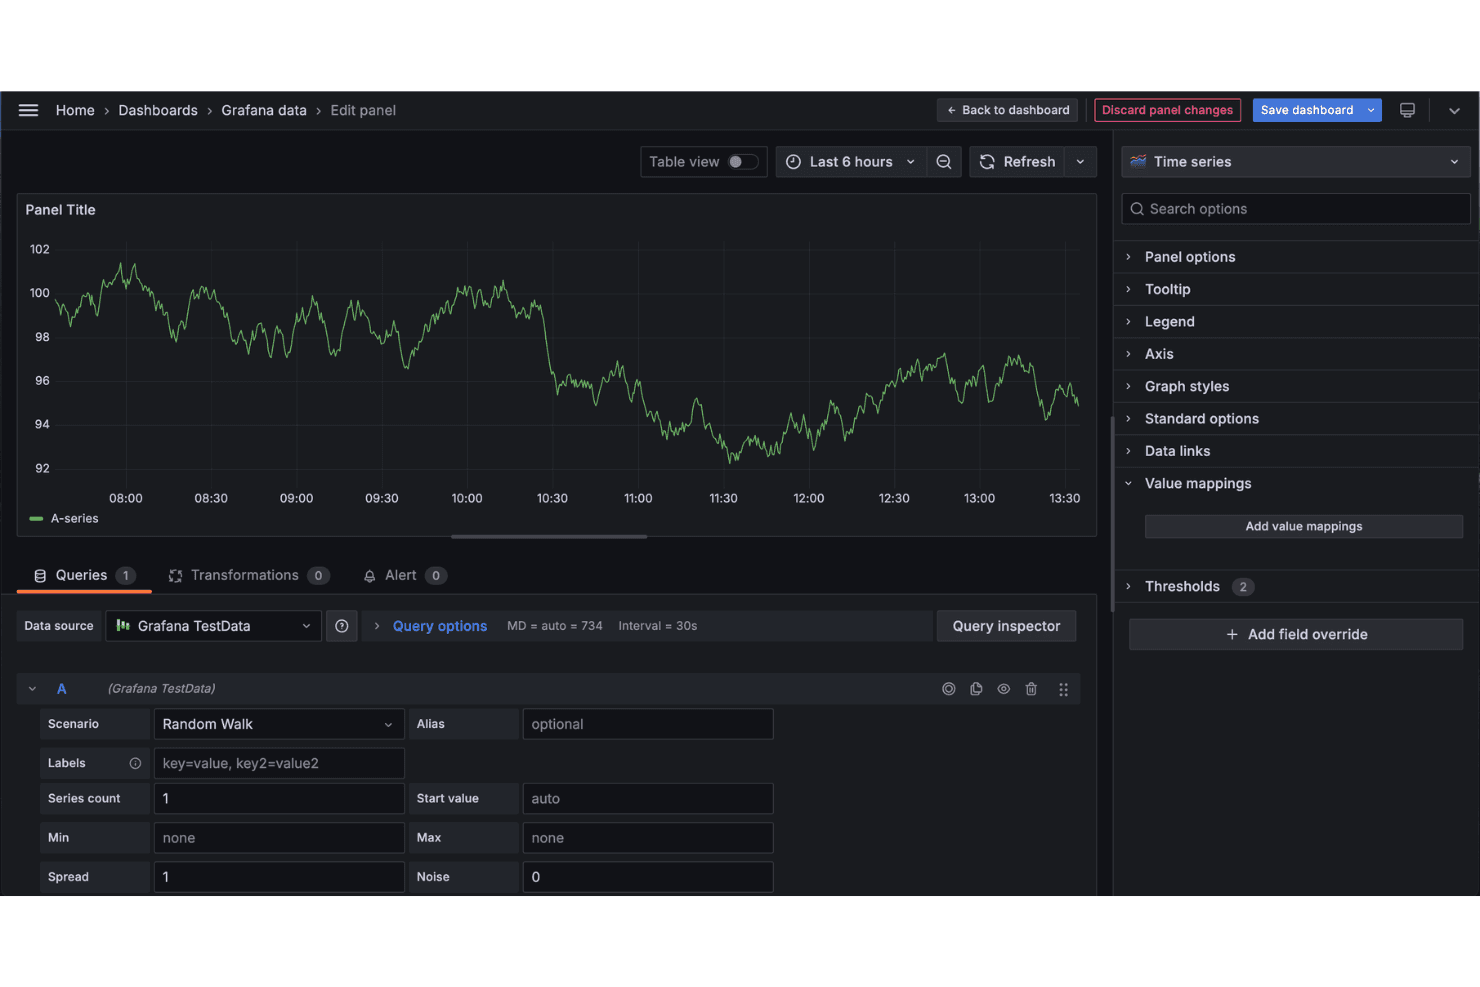
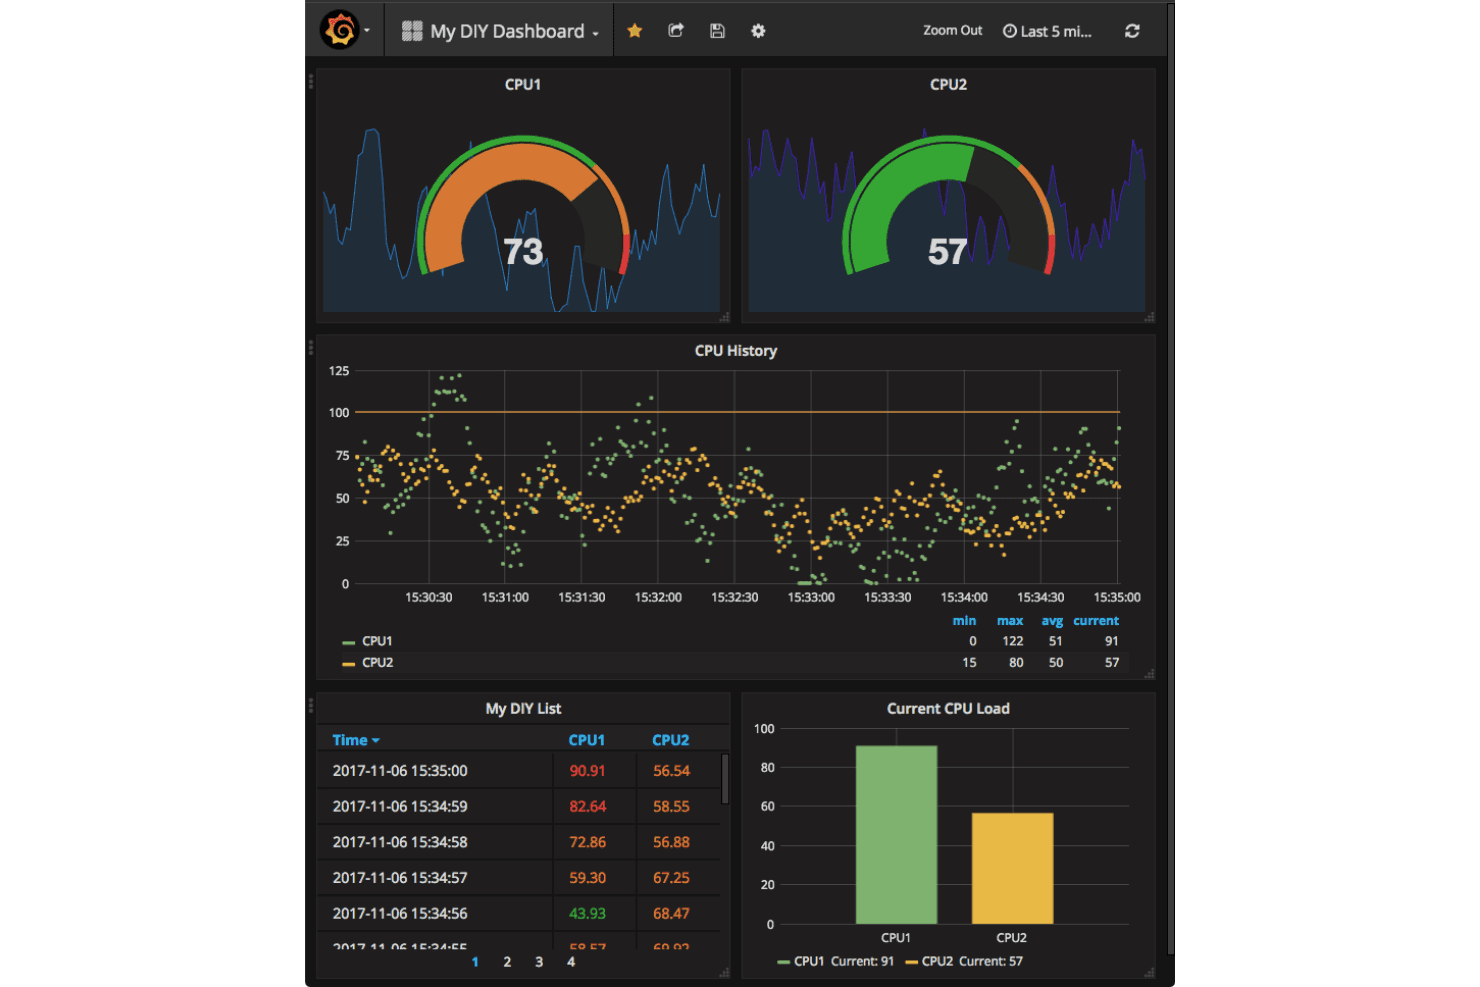
Dashboard Customization: You can create and personalize dashboards to fit your team's specific needs, making frontend data visualization intuitive. You can drag and drop widgets, adjust layouts, and apply themes to suit your preferences.
Alerting System: You can set up notifications to monitor critical metrics and alert your team about changes via email, Slack, or other channels, helping you stay proactive.
Data Source Support: You can connect to a wide range of data sources, allowing your team to visualize diverse datasets. Grafana supports databases such as Prometheus, InfluxDB, and Elasticsearch.
Annotations: You can add notes to your graphs to highlight significant events. Annotations appear as vertical lines on your charts, making it easy to correlate data points with real-world events.
Templating: You can use templates to create reusable dashboards, enhancing efficiency and consistency across your organization. This enables dynamic dashboard updates based on variables you define.
Time Series Analysis: Grafana's time series data capabilities let you analyze time-stamped telemetry data, enabling you to assess specific time frames and use queries to filter data.
Ease of Use
Grafana's can be challenging to use, especially for those unfamiliar with data visualization tools. While its interface is powerful, it requires time to master due to its complexity. It may take time for your team to learn how to fully utilize the platform, but once they do, Grafana's flexibility and customization options make it a valuable addition.

Integrations
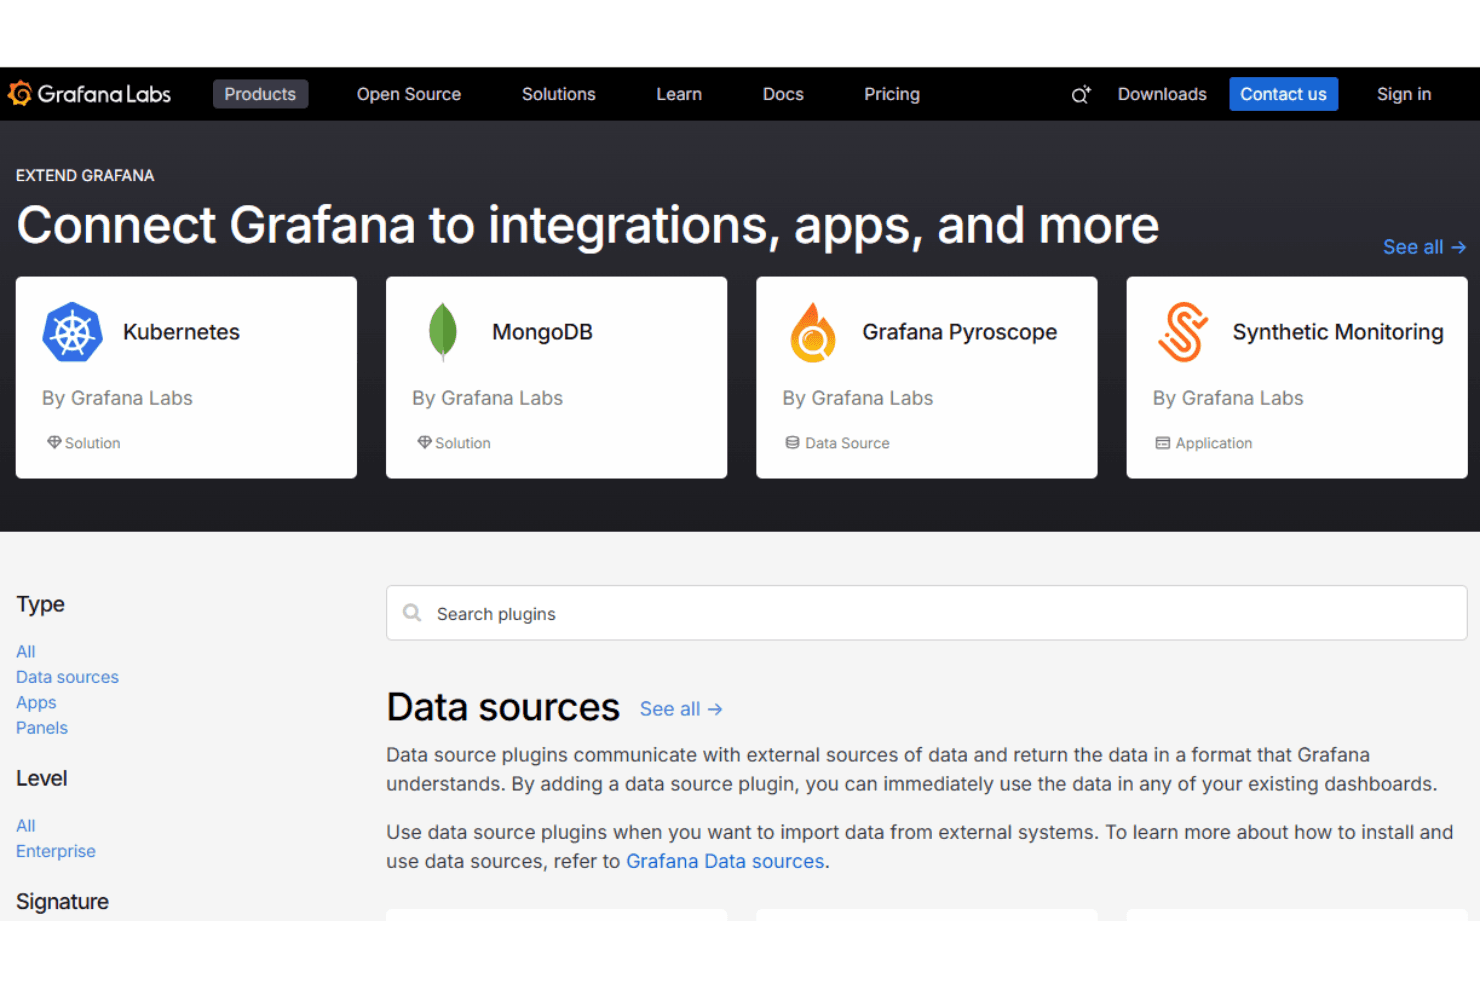
Grafana integrates with AWS, Prometheus, Elasticsearch, InfluxDB, Amazon CloudWatch, Azure Monitor, Google Cloud Monitoring, Loki, Jaeger, Alertmanager, and MySQL. The software also offers an API, is available for Linux, and can connect with third-party integration tools.
Grafana Specs
- API: Yes
- Bug Tracking: Yes
- CI/CD Integration: Yes
- Cloud Deployment: Yes
- Code Review: Yes
- Code Transformation: Yes
- Collaboration Support: Yes
- Data Export: Yes
- Data Import: Yes
- Developer Tools: Yes
- External Integrations: Yes
- Git Integration: Yes
- History/Version Control: Yes
- IDE Plugins: Yes
- Local Deployment: Yes
- Multi-User: Yes
- Notifications: Yes
- Project Management: Yes
- Release Management: Yes
- Static Analysis: Yes
- Task Scheduling/Tracking: Yes
- Testing: Yes


